Figures & data
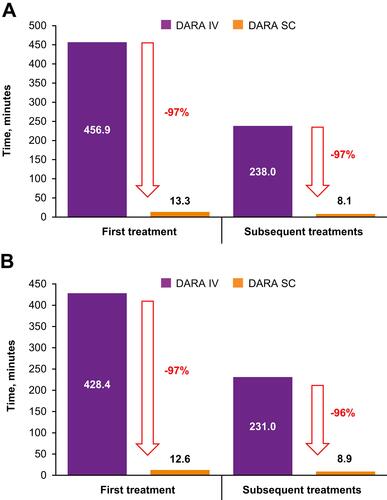
Figure 1 Median active HCP time for first and subsequent treatments (A) primary analysis and (B) sensitivity analysis*.
Note: *A sensitivity analysis was conducted comparing a subgroup of respondents with fully validated data with the overall population.
Abbreviations: DARA, daratumumab; HCP, healthcare provider; IV, intravenous; SC, subcutaneous.
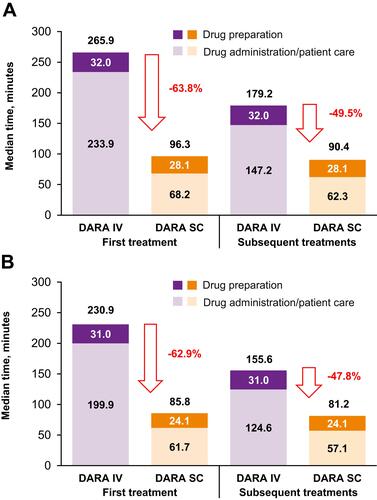
Figure 2 Duration of drug administration and active HCP involvement for first and subsequent treatments (A) primary analysis and (B) sensitivity analysis*.
Note: *A sensitivity analysis was conducted comparing a subgroup of respondents with fully validated data with the overall population.
Abbreviations: DARA, daratumumab; HCP, healthcare provider; IV, intravenous; SC, subcutaneous.
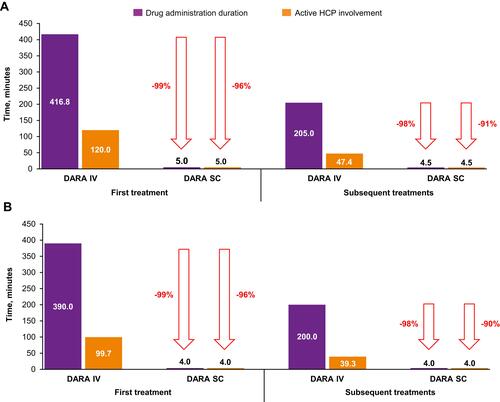
Figure 3 Median active HCP time: pre-specified activities in patient care area.
Abbreviations: ARRs, administration-related reactions; DARA, daratumumab; HCP, healthcare provider; IV, intravenous; SC, subcutaneous.
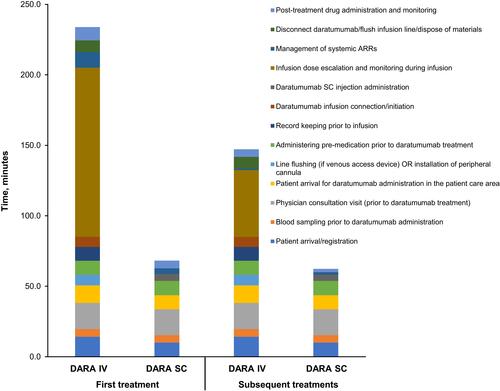
Figure 4 Estimated active HCP time per patient per year (pharmacy/drug preparation area and patient care area combined).
Abbreviations: DARA, daratumumab; HCP, healthcare provider; IV, intravenous; SC, subcutaneous.
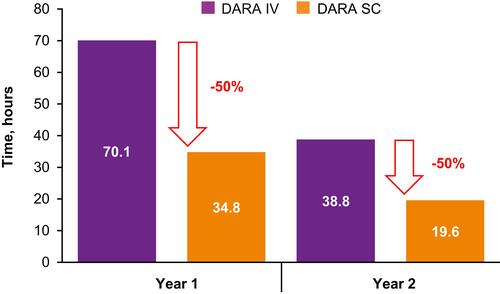
Figure 5 Estimated chair time for first and subsequent treatments (A) primary analysis and (B) sensitivity analysis*.
Note: *A sensitivity analysis was conducted comparing a subgroup of respondents with fully validated data with the overall population.
Abbreviations: DARA, daratumumab; IV, intravenous; SC, subcutaneous.