Figures & data
Table 1 Physician-Reported Patient Characteristics According to Number of Lines of Preventive Treatments Ever Received
Table 2 Clinical Characteristics According to Number of Lines of Preventive Treatments Ever Received
Figure 1 Migraine-Specific Quality of Life Questionnaire (MSQ) domain scores according to number of lines of preventive treatments ever received. The number of patients with data varied by group size (see ). Across all three groups, the response rate for this instrument was 98% (2748 of 2798) of patients who completed a patient self-completion form.
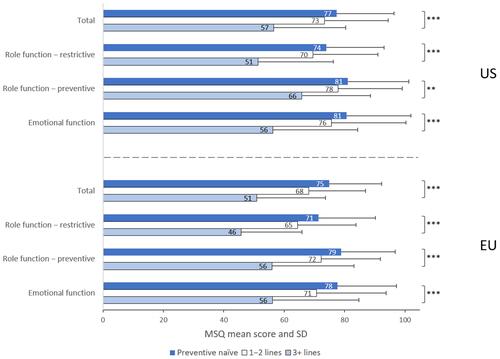
Table 3 MIDAS Items According to Number of Lines of Preventive Treatments Ever Received
Figure 2 Migraine Disability Assessment Scale (MIDAS) scores according to number of lines of preventive treatments ever received. Higher scores indicate greater disability. The number of patients with data varied by group size (see ). Across all groups, the response rate for this instrument was 83% (2316 of 2798) of patients who completed a patient self-completion form. Trends were consistent across regions (US + EU).
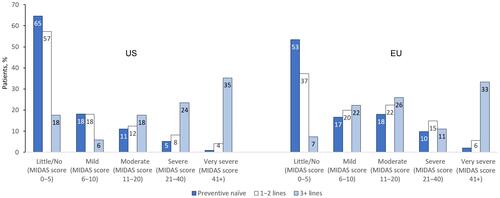
Figure 3 EQ-5D-5L scores according to number of lines of migraine preventive treatments (A) mean EQ-5D 5-level score cross-walked to 3-level score and (B) mean VAS score. Patients completed the 5-level EQ-5D; scores were cross-walked to the 3-level version.Citation25,Citation26 The number of patients with data varied by group size; the response rate for this instrument was 99% (2763 of 2798 patients who completed a patient self-completion form).
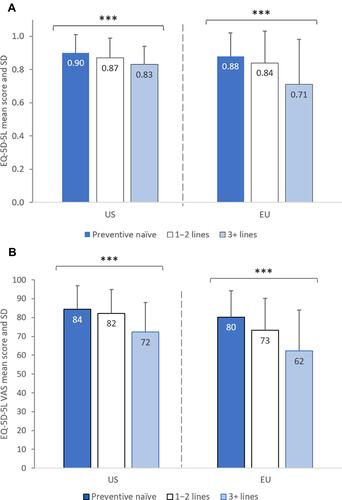
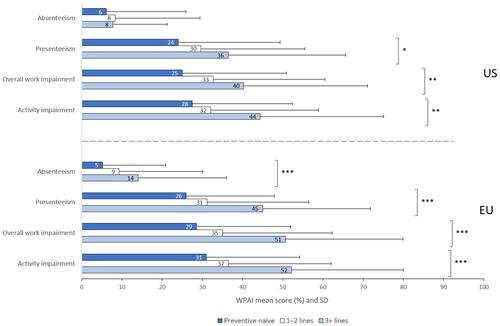
Figure 4 WPAI in the overall patient population according to number of lines of migraine preventive treatments. The number of patients with data varied by group size; the response rate for this instrument was 54% for work productivity impairment (patients in employment only; 1440 of 2798 patients who completed a PSC) and 94% for activity impairment (2633 of 2798 patients who completed a patient self-completion form).