
Figures & data
Table 1 Distribution of Characteristics Between MS and Non-MS Controls MEPS 2005–2015
Figure 1 Propensity score distribution before matching.
Notes: Multiple sclerosis = 1 denotes the case group (individuals with MS); multiple sclerosis = 2 denotes the control group (individuals without MS).
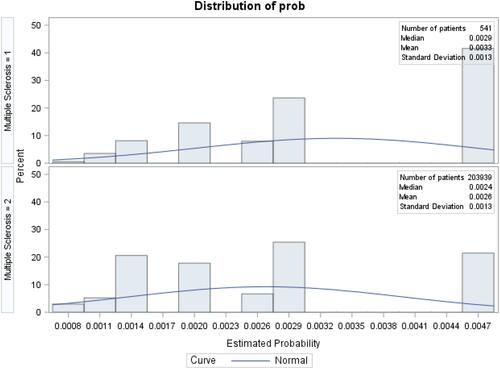
Figure 2 Propensity score distribution after matching.
Notes: Multiple sclerosis = 1 denotes the case group (individuals with MS); multiple sclerosis = 2 denotes the control group (individuals without MS).
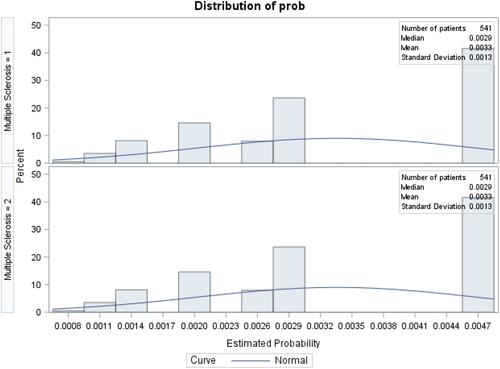
Table 2 Total and Subtypes of Costs Among Any Users (2018 US$)
Table 3 Unadjusted Total Expenditures by Comorbidities
Table 4 Intercepts and Parameter Estimates for MS vs Non-MS Groups from Separate OLS Regression Analyses on Logged Healthcare Expenditures (2018 US$)
Table 5 Multinomial Logistic Regression Analysis Physical Health Status
Table 6 Multinomial Logistic Regression Analysis Mental Health Status