Figures & data
Figure 1 Markov state-transition model with the seven proposed health states and possible transitions to be performed once for each screening method.
Notes: Whether type 2 diabetes and impaired fasting glucose are diagnosed or undiagnosed determines if the patients receive relevant treatments or interventions and whether associated costs and utilities are applied for each time interval. Dotted circles represent starting states.
Abbreviation: IFG, impaired fasting glucose; T2D, type 2 diabetes mellitus.
Abbreviation: IFG, impaired fasting glucose; T2D, type 2 diabetes mellitus.
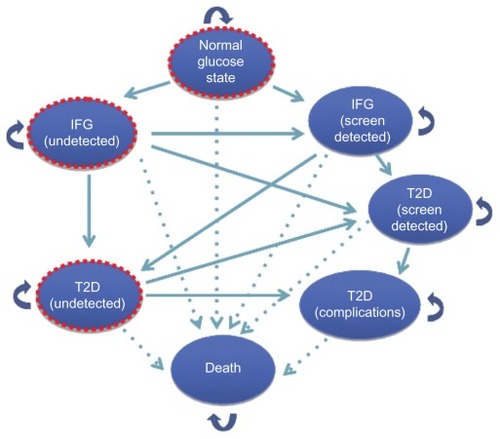
Figure 2 Markov model simulation for the impact of screening and early detection of impaired fasting glucose tolerance and type 2 diabetes in Canada.
Notes: Two Markov models are run, one for a no screening strategy and the other for a prediabetes and diabetes screening strategy. Appropriate costs for treatment or lifestyle modification programs are applied for those detected by screening as IFG or T2DM, and those who are clinically diagnosed with T2DM because of diabetic complications. Conventional screening is denoted by “Yes”.
Abbreviations: IFG, impaired fasting glucose; TP, true positive test result; TN, true negative; FN, false negative; FP, false positive; T2DM, type 2 diabetes mellitus.
Abbreviations: IFG, impaired fasting glucose; TP, true positive test result; TN, true negative; FN, false negative; FP, false positive; T2DM, type 2 diabetes mellitus.
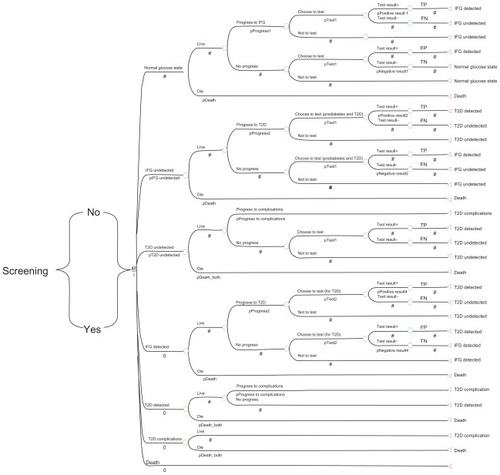
Table 1 Risk factors for type 2 diabetesTable Footnote1
Table 2 Base-case input values for the Markov modelTable Footnote1
Figure 3 Cost-effectiveness comparison between conventional screening for type 2 diabetes mellitus and no screening.
Notes: Conventional screening strategy (square) is compared with no screening (triangle). The dominated strategy is highlighted by a circle (ie, conventional screening).
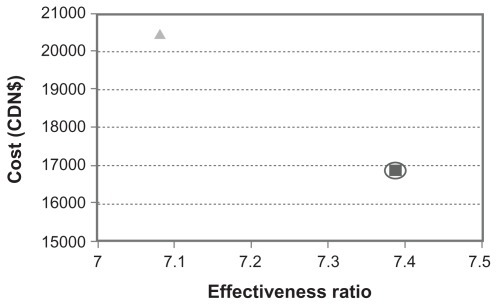
Table 3 Sensitivity analysis and variation in frequency of screening
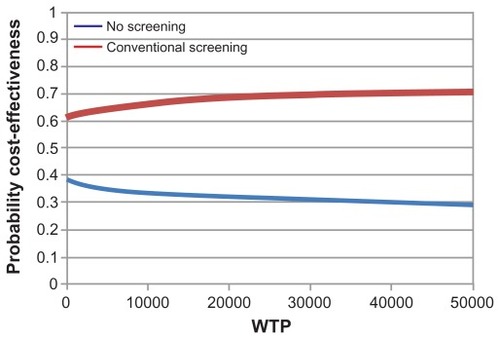
Figure 4 Cost-effectiveness acceptability curve for conventional screening for type 2 diabetes compared with “no screening” strategy.
Abbreviation: WTP, willingness to pay.