Figures & data
Table 1 Background Information on Total Study Population at Baseline
Table 2 Non-Imputed and Unadjusted EQ-5D-3L Utility Values for the HFNC-Treated Group and the Control Group at Baseline, Six Months, and 12 Months of Follow-Up
Table 3 Non-Imputed and Unadjusted Mean Resource Utilization per Patient for the HFNC-Treated Group and the Control Group Over the 12-Month Follow-Up and Applied Unit Costs
Table 4 Unadjusted Mean Costs (£) per Patient in the HNFC-Treated Group and the Control Group Over the 12-Month Follow-Up Presented into Cost Categories
Table 5 Incremental Cost-Effectiveness Ratios (ICERs) for the Base Case Analysis and Scenario Analyses
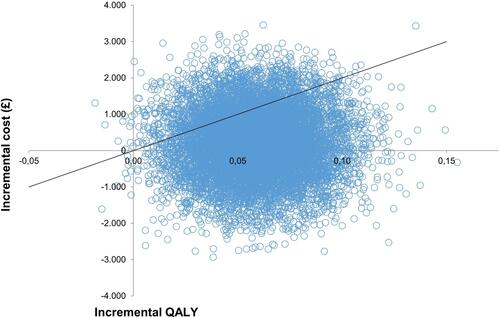
Figure 1 Incremental cost-effectiveness scatterplot based on the probabilistic sensitivity analysis for the base case analysis.