Figures & data
Figure 1 Illustration of possible ways of patient distribution in the pharmacoeconomic model (Figure 1A: by directly entering the estimated number of patients in each treatment regimen, Figure 1B: on the basis of the product of the total number of patients and the estimated shares (%) in each treatment regimen).
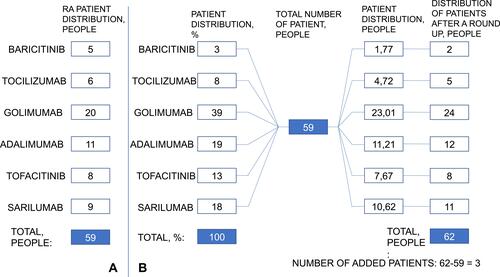
Table 1 The Results of the Budget Impact Analysis When Using Various Approaches to the Adjustment of “Additional Patients”
Table 2 Calculations of Distribution Patients by Level of Treatment Costs in Various Schemes
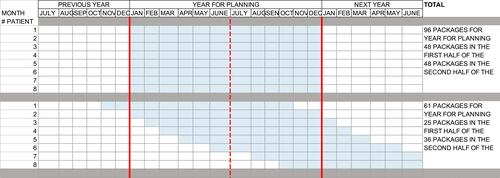
Figure 2 An example of a one-time and uniform entry of patients into the pharmacoeconomic model with a treatment course of 4 months.
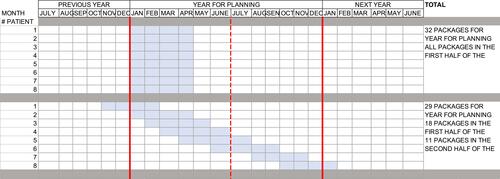
Figure 3 An example of a one-time and uniform entry of patients into the pharmacoeconomic model with a treatment course of 1 year.