Figures & data
Table 1 COVID-19 and Mortality Rate
Table 2 Event Rate in the Diabetic Population by Type of Treatment and Cost per Event
Table 3 Drop in Diabetic Patient Visits Observed in 2020
Table 4 Trend of Use of the Antidiabetic Therapies Analyzed (2018–2020)
Table 5 Effects of Slowdown in the Use of Innovative Antidiabetic Therapies
Table 6 Effects of Reducing Hospital Procedures and Follow-Up Visits in Diabetic Patients at Risk
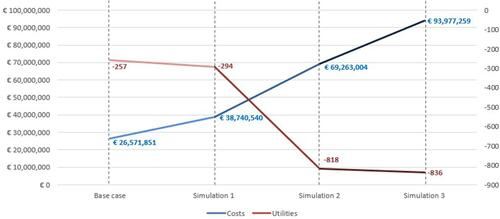
Figure 1 Simulation scenario results: analysis of the lockdown effects on the slowdown in innovative antidiabetic therapies use.
Notes: Base case: linear growth of innovative antidiabetic therapies consumption in 2020 compared to 2019 (direct costs); Simulation 1: linear growth of innovative antidiabetic therapies consumption used in 2020 compared to 2019 (direct costs + indirect costs); Simulation 2: double growth of innovative antidiabetic therapies consumption in 2020 compared to 2019 (direct costs); Simulation 3: double growth of innovative antidiabetic therapies consumption in 2020 compared to 2019 (direct costs + indirect costs).
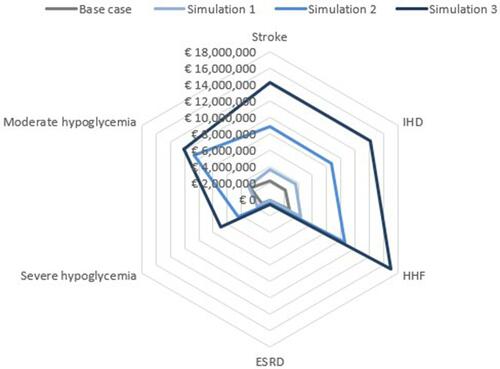
Figure 2 Simulation scenario results: potential prolonged effects of restriction, simulation scenario 30, 45 and 60 days.
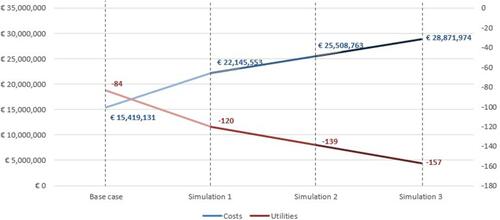
Figure 3 Summary of results: base case and simulation scenarios.