Figures & data
Figure 1 Criteria applied for the identification of TRD patients.
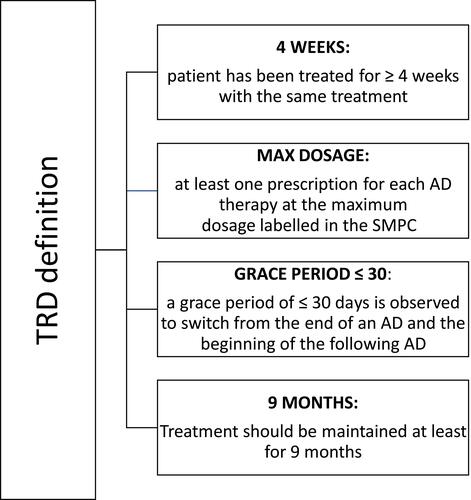
Figure 2 Italian projection of patient distribution according to psychiatric-related resource utilization considering (A) maximum dosage labelled in SMPC and (B) the ratio between mean dosage prescribed/maximum dosage labeled in SMPC.
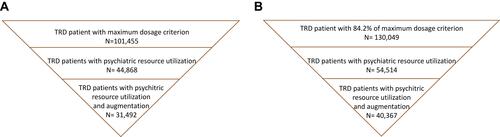
Figure 3 Psychiatry-related hospitalizations according to antidepressant lines.
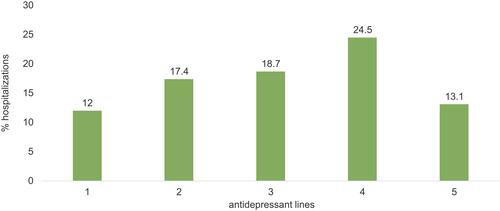
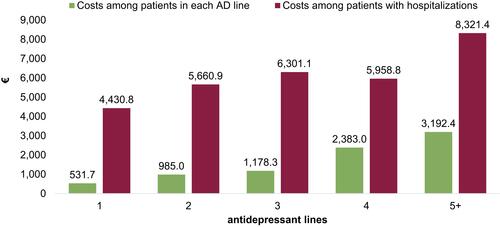
Figure 4 Mean annual all-cause and psychiatry-related costs according to antidepressant lines.
Notes: All comparisons were statistically significant (p<0.001). The red box highlights the psychiatry-related costs. Overall psychiatry-related costs for each antidepressant line is reported next to red brackets.
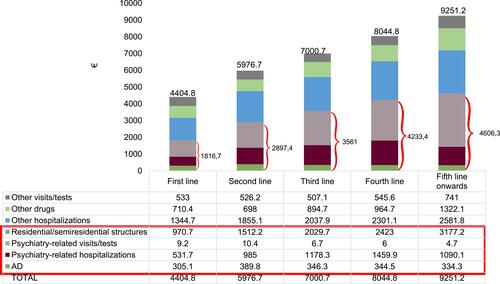
Figure 5 Mean annual costs of residential/semiresidential structures according to antidepressant lines.
Notes: All comparisons were statistically significant (p<0.001). The number of patients within each line are reported in Supplementary Table 1.
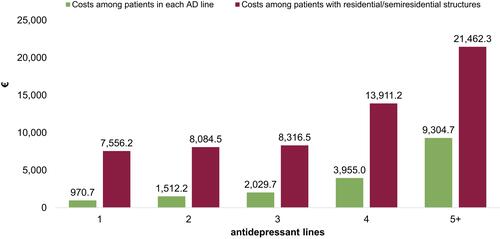
Figure 6 Mean annual costs of psychiatry-related hospitalizations according to antidepressant lines.
Notes: All comparisons were statistically significant (p<0.001). The number of patients within each lines are reported in Supplementary Table 2.