
Figures & data
Figure 1 Schematic presentation of the model. *Mild, moderate or severe, #transient state (ie, the patients transit back to the previous health state after one cycle and either continue or discontinue anticoagulation treatment). Reproduced from Hallinen T, Soini EJ, Linna M, Saarni SI. Cost-effectiveness of apixaban and warfarin in the prevention of thromboembolic complications among atrial fibrillation patients. Springerplus. 2016;5(1):1354, under the terms of the creative commons attribution 4.0 international license (http://creativecommons.org/licenses/by/4.0/).Citation18
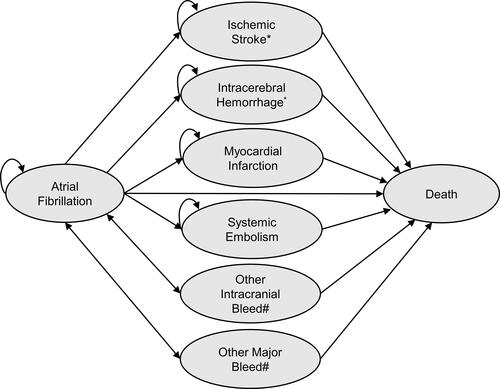
Table 1 Risk of Modeled Health Events According to Treatment
Table 2 Costs and Quality of Life Inputs
Table 3 Results of the Cost-Effectiveness Analysis
Figure 2 The cost-effectiveness plane for apixaban versus (A) warfarin, (B) dabigatran and (C) rivaroxaban. Green line depicts ICER threshold of 35,000 euros per QALY gained. The points lying below the line represent the simulations where apixaban was either cost-effective or dominating (South-West quadrant) versus its comparator.
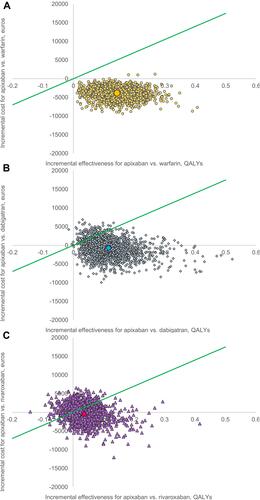
Figure 3 The cost-effectiveness acceptability curve for apixaban versus warfarin, dabigatran and rivaroxaban.
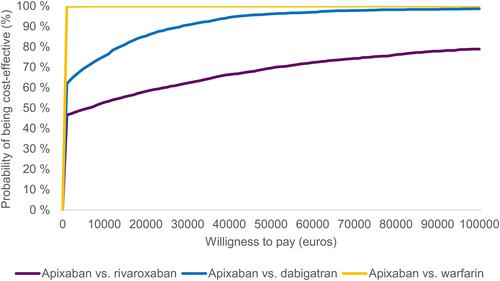
Table 4 Results of the Deterministic Sensitivity Analyses