Figures & data
Figure 1 Model structure. Arrows indicate possible transitions through health states. “On treatment” and “Off treatment” are subcategories of health states included in PFS.
Abbreviations: PFS, progression-free survival; PD, progressive disease; Y 0–1, within 2 years; Y 2+, beyond 2 years.
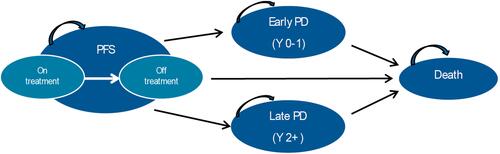
Figure 2 Estimated survival curves based on GALLIUM study: Markov trace and time in health state.
Abbreviations: PFS, progression-free survival; PD, progressive desease; O-chemo, obinutuzumab and chemotherapy; R-chemo, rituximab and chemotherapy.
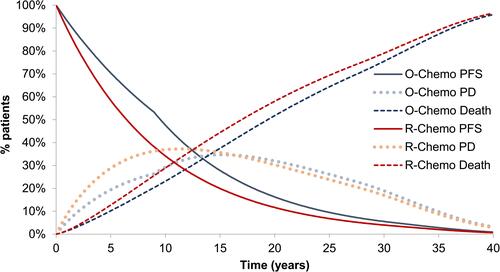
Table 1 Utility values
Table 2 Costs of drugs, monitoring, adverse-event management, and postprogression therapy
Table 3 Base-case LYs, QALYs, and costs
Table 4 ICER and ICUR
Figure 3 Cost-effectiveness plane.
Abbreviations: O-chemo, obinutuzumab and chemotherapy; R-chemo, rituximab and chemotherapy.
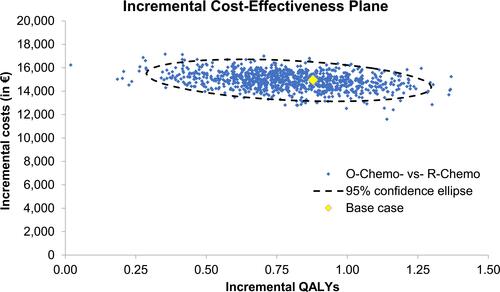
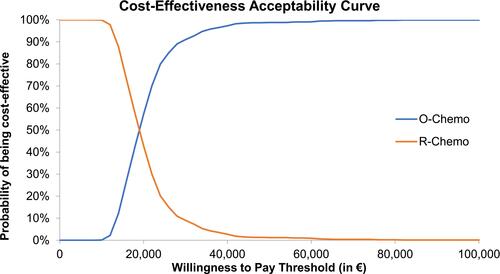
Figure 4 Probability of being the most cost-effective treatment.
Abbreviations: O-chemo, obinutuzumab and chemotherapy; R-chemo, rituximab and chemotherapy.