
Figures & data
Figure 1 Flow chart of sample selection and missing data.
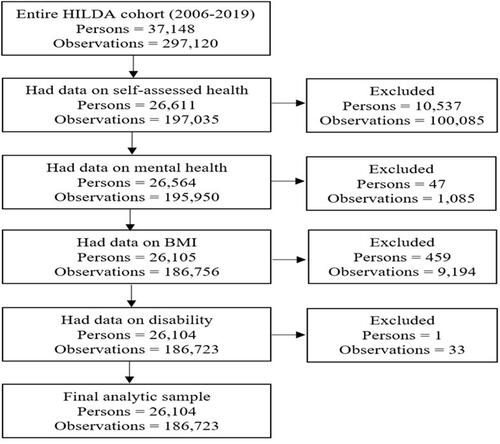
Table 1 Distribution of the Analytic Sample: Baseline, Final, and Pooled Across All Waves (Persons = 26,104, Observations = 186,723)
Table 2 Self-Perceived Poor or Fair Health Outcomes by Age and Gender at Four Different Periods
Figure 2 Distribution of the self-assessed fair or poor health outcomes by weight status, 26,104 persons, 186,723 observations, 2006 to 2019.
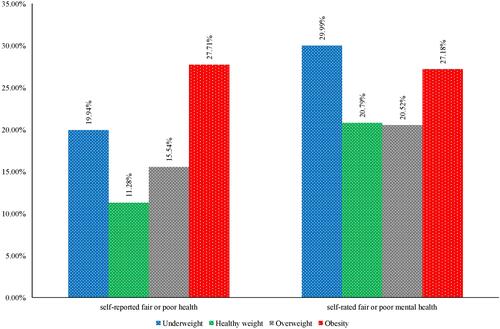
Figure 3 Distribution of the self-assessed fair or poor health outcomes by disability status, 26,104 persons, 186,723 observations, 2006 to 2019.
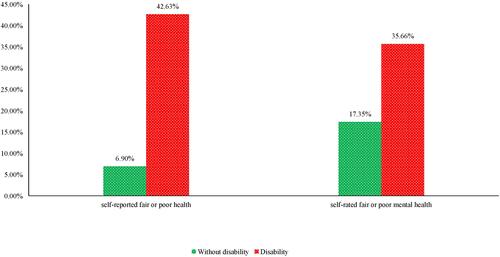
Table 3 Unadjusted and Adjusted Random-Effect Regression Results for the Between-Person Difference in Self-Perceived Health Outcomes Due to Obesity and Disability, 26,104 Persons, 186,723 Observations, 2006 to 2019