Figures & data
Table 1 Cost Inputs
Figure 1 Nationwide VA/DoD incobotulinumtoxinA versus onabotulinumtoxinA total costs.
Notes: This figure reports the study’s primary outcome, which was the difference in total direct costs nationally for incobotulinumtoxinA (real-world) versus having hypothetically utilized onabotulinumtoxinA (projected) for similar utilization.
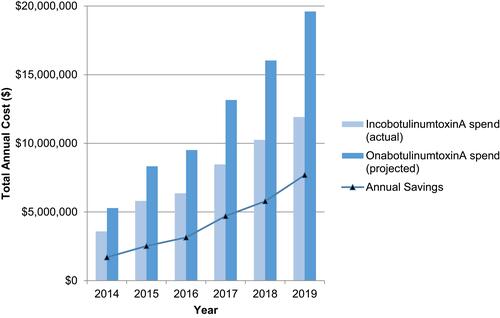
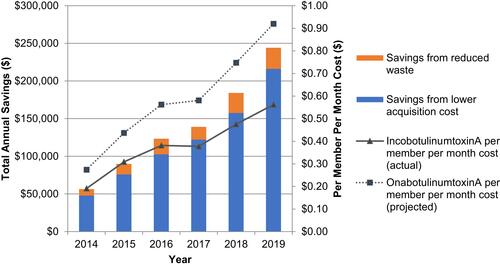
Figure 2 IncobotulinumtoxinA versus onabotulinumtoxinA cost outcomes at an anonymized institution.