Figures & data
Table 1 Background of participants (n = 355)
Figure 1 Work performance loss in each group.
Notes: The degree of work performance loss was 5.65% in the definite dry eye group, 4.37% in the marginal dry eye group, 6.06% in the self-reported dry eye group, and 4.27% in the control group. Productivity in the self-reported dry eye group was significantly lower than that in the control group. *P < 0.05 (Dunnett’s test). Error bar shows 95% confidence interval.
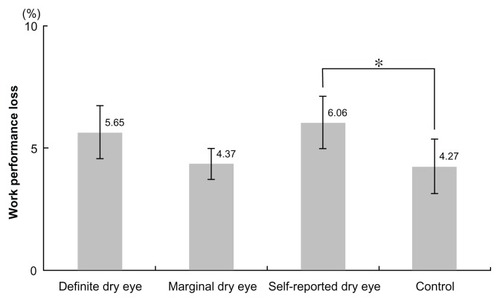
Figure 2 Work productivity loss by subscale scores for four aspects of work limitations, ie, time management (A), physical demands (B), mental/interpersonal (C), and output demands (D).
Notes: The mental/interpersonal score was significantly lower in the definite dry eye group (P < 0.05) and the self-reported dry eye group (P < 0.01). *P < 0.05; **P < 0.01 (one-way analysis of variance; Tukey or Games-Howell test was used for multiple comparisons). Error bar shows 95% confidence interval. Participants who had missing values (11 in group 1; 15 in group 2; four in group 3; 11 in group 4) were excluded from the analysis.
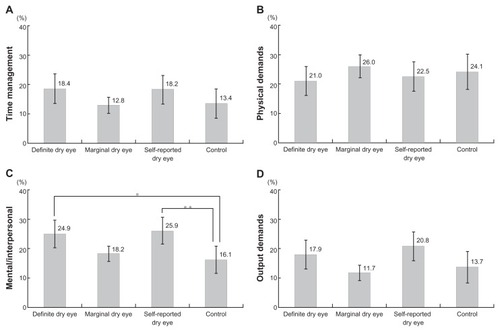
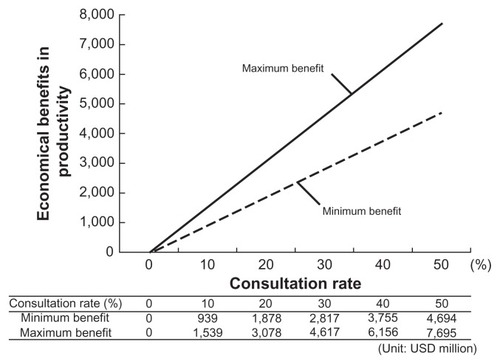
Figure 3 Economic benefits in productivity from providing treatment for dry eye.
Note: When 50% of office workers with dry eye received treatment, the economic benefits were estimated to be USD 4694–7693 million.