Figures & data
Figure 1 Construction of life engagement scores.
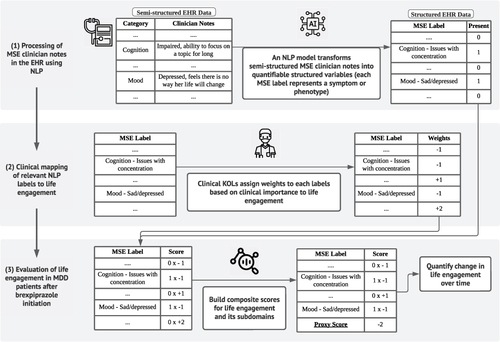
Table 1 Demographic and Clinical Characteristics at the Start of Treatment
Table 2 Summary of Selected Clinical Labels for Life Engagement Score
Table 3 Descriptive Statistics for Baseline, Maximum Change, and First Change in Life Engagement Score
Figure 2 Comparison of life engagement scores at index event and different follow-up time points.
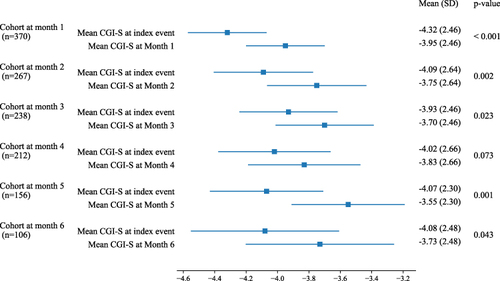
Figure 3 Comparison of domain-specific life engagement scores at index event and different follow-up time points: (A) cognitive domain, (B) emotional domain, (C) physical domain, (D) social domain.
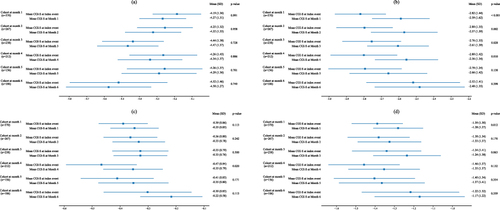
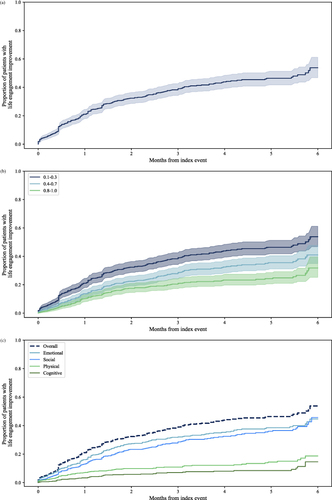
Figure 4 Survival analysis for time to life engagement score improvement among brexpiprazole patients (ordered from top to bottom): (A) Cumulative rates of patients with life engagement improvement over time. (B) Cumulative rates of patients with life engagement score improvement over time using different thresholds for life engagement score improvement indicators. (C) Cumulative rates of patients with domain-specific improvement over time.