Figures & data
Table 1 Patient Demographics at Index (Initiation of Teriflunomide Treatment), and Comorbidities Recorded in the 1-Year Pre-Index Period
Figure 1 Patient attrition from Merative™ (formerly IBM®) MarketScan® Research Database.
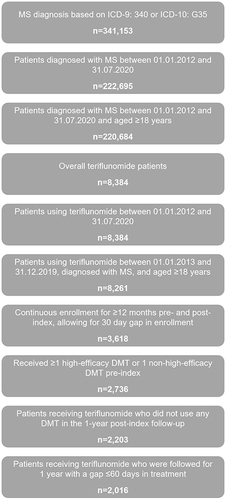
Table 2 Healthcare Resource Utilization Rates and Healthcare Costs per Patient per Year at 1 Year Pre Index Vs 1 Year Post Index (n=2016)
Figure 2 Healthcare resource utilization in the 1-year pre- and 1-year post-index periods. (A) Frequency of all-cause and (B) MS-specific emergency room visits.
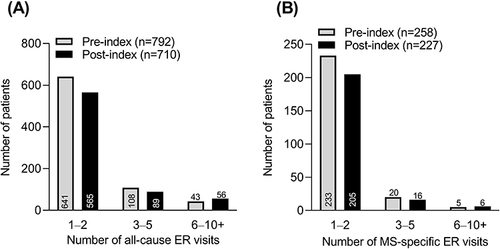
Figure 3 Average cost of disease-modifying treatments (DMTs) in the 1-year pre- and 1-year post-index periods. aAll costs adjusted to 2020 US dollars using the healthcare component of the Consumer Price Index. The cost of the first claim for teriflunomide is included at index. P-values calculated using Wilcoxon rank-sum test.
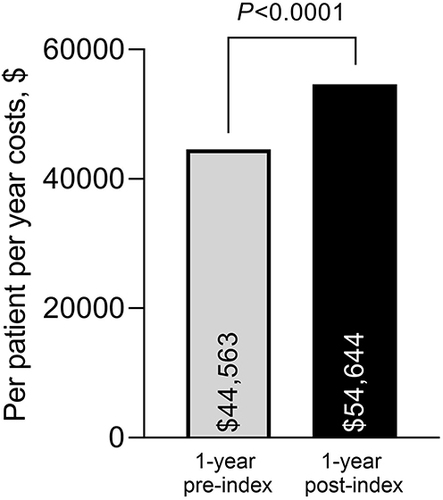
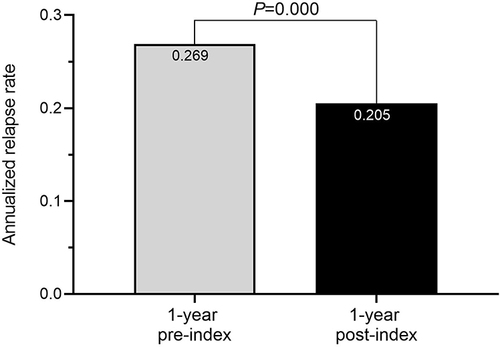
Figure 4 Annualized relapse rate in the 1-year pre- and 1-year post-index periods. Relapse rates compared using Poisson regression. P-values calculated using Wilcoxon rank-sum test.