Figures & data
Figure 1 Participant disposition.
Notes: aIncluded participants with claims for AS obtained through Orsini Specialty Pharmacy.
Abbreviations: AP, antipsychotic; AS, aripiprazole tablets with sensor; yrs, years.
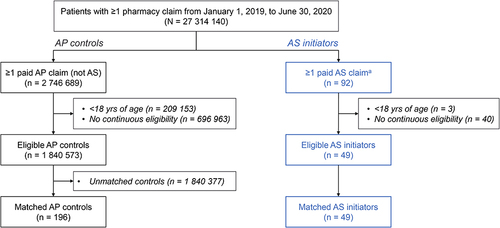
Table 1 Participant Demographics and Baseline Characteristics
Table 2 Psychiatric Medication Utilization at Baseline and Follow-Up
Table 3 Adjusted Odds Ratios for Psychiatric HCRU Events Using Zero-Inflated Regression Models
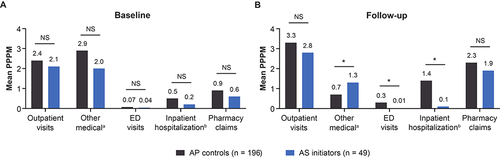
Figure 2 Frequency of psychiatric HCRU events at baseline and follow-up (unadjusted results).
Notes: (A) Baseline was defined as the 3-month period prior to index date. (B) Follow-up was defined as the 6-month period after index date. aServices provided. bAdmissions. *P <0.05.
Abbreviations: AP, antipsychotic; AS, aripiprazole tablets with sensor; ED, emergency department; HCRU, healthcare resource utilization; NS, not significant; PPPM, per participant per month.