
Figures & data
Table 1 The Utilisation of Total Medicines, Cardiovascular Medicines, Lipid-Modifying Medicines and Statins in the Republic of Srpska During 2010–2020, Expressed in DDD/TID and Share (%)
Figure 1 Trends in statin utilisation and expenditure from 2010 to 2020. (A) Trends in statin utilisation (DDD/TID); (B) Percent of total statin utilisation for individual statins; (C) Trends in statin expenditure; (D) Percent of total statin expenditure for individual statins; (E) Price per DDD of statins.
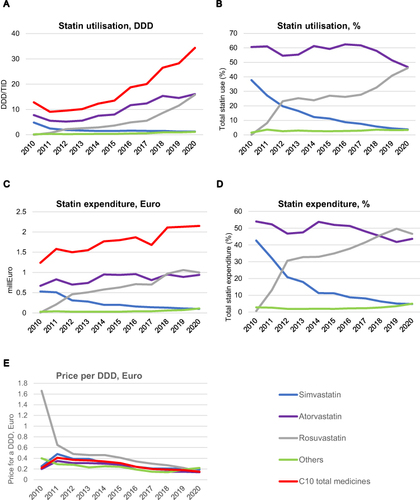
Figure 2 The utilisation of lipid-modifying medicines in the Republic of Srpska in 2019 and 2020 vs other European countries in the same years expressed in DDD/TID (Adapted from OECD (2021), Health at a Glance 2021: OECD Indicators, OECD Publishing, Paris, https://doi.org/10.1787/ae3016b9-en).Citation25 DDD/TID – Defined Daily Dose/Thousand Inhabitants per Day; The solid blue lines – the utilisation of lipid-modifying medicines in European countries in 2020; The green dashed lines – The utilisation of lipid-modifying medicines in European countries in 2019; The red text – The utilization of lipid-modifying medicines in the Republic of Srpska in 2019 and 2020.
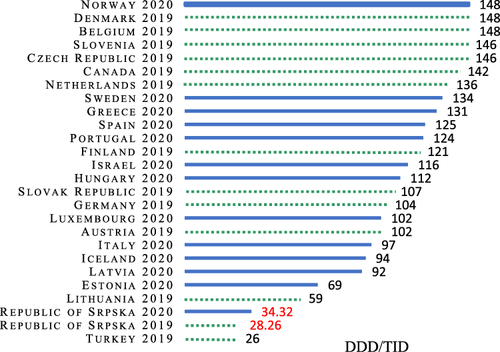
Table 2 The Utilisation of Lipid-Modifying Medicines in the Republic of Srpska in the Period from 2010 to 2020, Expressed by the DDD/TID Day and Share (%)
Table 3 The Utilisation of Cardiovascular Medicines and Lipid-Modifying Medicines by Age Groups and Gender of Prescriptions in the Republic of Srpska During 2013, 2016 and 2019, Expressed in DDD/TID and Share (%)
Table 4 Expenditure of Total Medicines, Cardiovascular Medicines, Lipid-Modifying Medicines and Statins in Republic of Srpska During 2010–2020, Expressed in Million Euro and the Shares (%)