
Figures & data
Table 1 Baseline Demographics and Clinical Characteristics
Figure 1 Identification of the study population.
Abbreviations: ART, antiretroviral therapy; BMI, body mass index; c, cobicistat; CKD, chronic kidney disease; DRV, darunavir; DTG, dolutegravir; ESRD, end-stage renal disease; FTC, emtricitabine; PLWH, people living with HIV-1; TAF, tenofovir alafenamide.
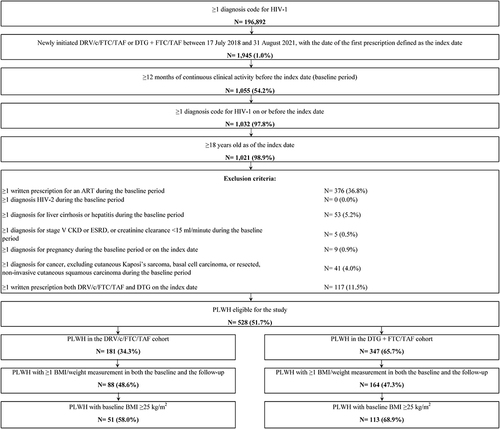
Figure 2 Continued.
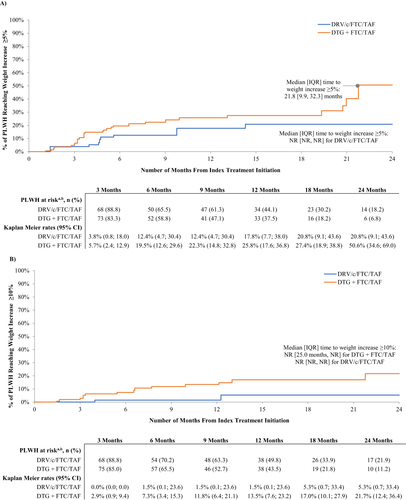
Figure 2 Kaplan Meier curves of time to weight/BMI increase above threshold. (a) Time to weight increase ≥5%. (b) Time to weight increase ≥10%. (c) Time to BMI increase ≥5%. (d) Time to BMI increase ≥10%.
Notes: (a) Of note, the number of PLWH reported in this weighted population represents the sum of weights for the corresponding PLWH, rounded to the nearest integer. The proportions displayed were calculated prior to the rounding and may be slightly different than if they were calculated based on rounded numbers. (b) Refers to the population at risk of having the event at that point in time (ie, PLWH who have not had the event and have not been lost to follow-up).
Abbreviations: BMI, body mass index; c, cobicistat; CI, confidence interval; DRV, darunavir; DTG, dolutegravir; FTC, emtricitabine; IQR, interquartile range; NR, not reached; PLWH, people living with HIV-1; TAF, tenofovir alafenamide.
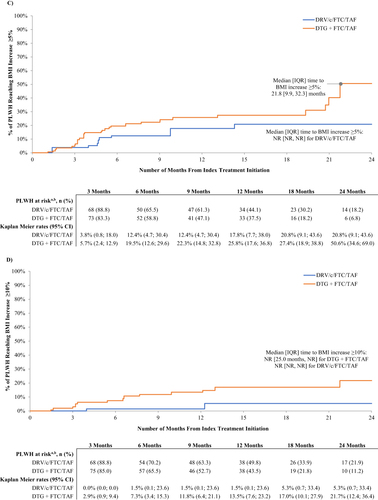
Figure 3 Comparison of time to weight or BMI increase outcome.
Notes: *Significant at the 5% level. (a) Of note, the number of PLWH reported in this weighted population represents the sum of weights for the corresponding PLWH, rounded to the nearest integer. The proportions displayed were calculated prior to the rounding and may be slightly different than if they were calculated based on rounded numbers. (b) A hazard ratio >1 indicates that the DTG + FTC/TAF cohort had a higher risk of a weight or BMI increase than the DRV/c/FTC/TAF cohort. (c) Non-parametric 95% bootstrap CIs and p-values were obtained from 500 bootstrap resamples. At each bootstrap resample, the inverse probability of treatment weights were re-estimated. (d) Data not available, given that the Cox proportional hazard models for these outcomes did not converge.
Abbreviations: BMI, body mass index; c, cobicistat; CI, confidence interval; DRV, darunavir; DTG, dolutegravir; FTC, emtricitabine; HR, hazard ratio; PLWH, people living with HIV-1; TAF, tenofovir alafenamide.
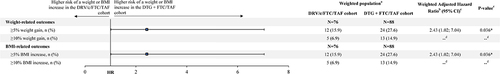
Table 2 Baseline BMI Category and Proportion of PLWH with BMI Category Shiftsa During Follow-Up