Figures & data
Figure 1 Diagram of patient flow in the RECOGNIZE II study, before matching.
Note: Boxes with dashed lines represent excluded patients.
Abbreviations: HK, hyperkalemia; SZC, sodium zirconium cyclosilicate.
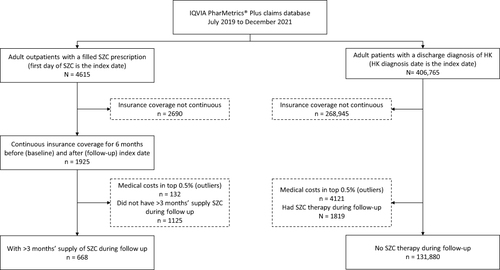
Table 1 Patient Demographics, Comorbidities, Baseline Treatments, and Healthcare Resource Utilization After 1:1 Matching
Figure 2 Mean hyperkalemia-related medical costs over 6 months’ follow-up for patients receiving long-term SZC treatment (SZC cohort) compared with those of matched patients with hyperkalemia not on SZC (non-SZC cohort).
Notes: *P<0.001 versus non-SZC cohort. Costs were adjusted for inflation to 2021 US dollars.
Abbreviations: ED, emergency department; SZC, sodium zirconium cyclosilicate.
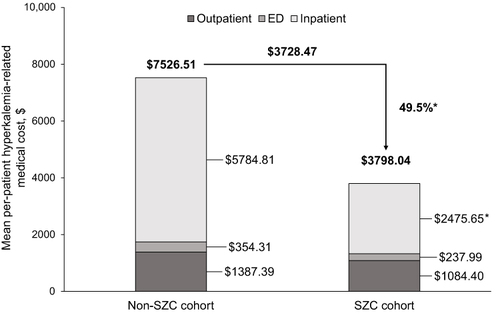
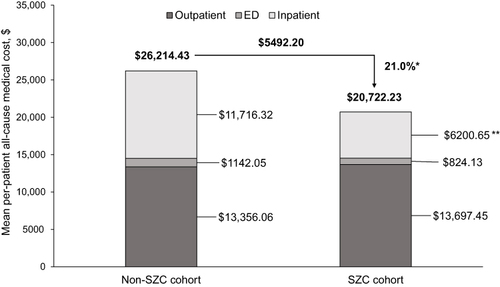
Figure 3 Mean all-cause medical costs over 6 months’ follow-up for patients receiving long-term SZC treatment (SZC cohort) compared with those of matched patients with hyperkalemia not on SZC (non-SZC cohort).
Notes: *P<0.01 versus non-SZC cohort; **P<0.001 versus non-SZC cohort. Costs were adjusted for inflation to 2021 US dollars.
Abbreviations: ED, emergency department; SZC, sodium zirconium cyclosilicate.