
Figures & data
Figure 1 Sample selection diagram.
Notes: aDiagnosis of PD was identified using International Classification of Diseases-9-Clinical Modification (ICD-9-CM) diagnosis code (332.0) or ICD-10-CM diagnosis code (G20). bDrug classes of interest included levodopa, dopamine agonists, monoamine oxidase type B inhibitors, and others (ie, amantadine, anticholinergics, catechol-O-methyltransferase inhibitors, and combination therapies).
Abbreviation: PD, Parkinson’s disease.
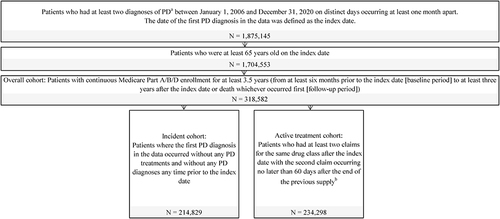
Table 1 Baseline Characteristics Stratified by Patient Cohort
Figure 2 Treatment patterns of incident cohort. (A) Distribution of first, second, and third lines of therapy; (B) levodopa dosing; (C) time to treatment initiation; (D) time to treatment discontinuation.
Notes: a“Other therapies” included amantadine, anticholinergics, catechol-O-methyltransferase inhibitor, levodopa inhaler, istradefylline, and Stalevo. b“Other regimens with N<1000” included regimens with a sample size of less than 1000 within each line of therapy. c“No further treatment” included patients who did not have treatment claims in the current line among those who have received treatment in the previous line. The counts included those who were censored at this line. dThe outcome event was defined as initiation of first PD treatment. Patients were censored at the end of study follow-up period. eThe outcome event was defined as 1L discontinuation. Patients were censored at the end of study follow-up period.
Abbreviations: 1L, first line; 2L, second line; 3L, third line; CI, confidence interval; DAs, dopamine agonists; MAO-B, monoamine oxidase B; NR, not reached; PD, Parkinson’s disease; SD, standard deviation.
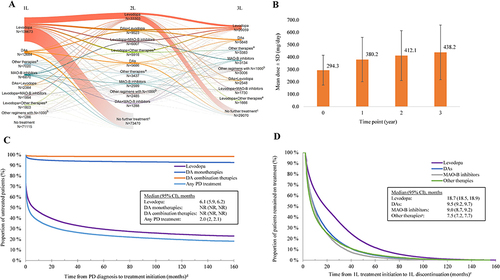
Table 2 All-Cause HRU Over 6-Month Cycles Associated with PD Symptoms Among Overall Cohort
Table 3 All-Cause HRU Over 6-Month Cycles Associated with Drug-Specific AEs Among Active Treatment Cohort
Table 4 All-Cause Healthcare Costs Over 6-Month Cycles Associated with PD Symptoms Among Overall Cohort
Table 5 All-Cause Healthcare Costs Over 6-Month Cycles Associated with Drug-Specific AEs Among Active Treatment Cohort