Figures & data
Figure 1 Schematic of the probabilistic cohort-level state-transition model.
Note: Response was assessed based on sarcoidosis treatment score.
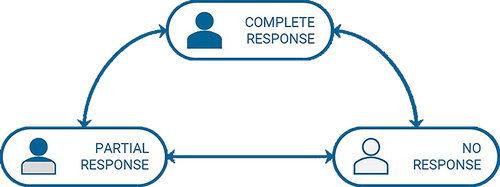
Table 1 Clinical Parameters Among Patients with Symptomatic Pulmonary Sarcoidosis
Table 2 Healthcare Resource Use and Cost Inputs
Table 3 Health Utilities and Disutilities
Table 4 Base Case Results for Incremental Cost-Effectiveness Among Patients with Symptomatic Sarcoidosis (2023 USD)
Table 5 Base Case per Patient-Year Costs Among Patients with Symptomatic Sarcoidosis Over 2 Years (2023 USD)
Figure 2 Tornado chart: DSA comparing Acthar Gel and standard of care. DSA was performed for analysis comparing a time horizon of 2 years and a payer perspective.
Abbreviations: DSA, deterministic sensitivity analysis; QALY, quality-adjusted life-year.
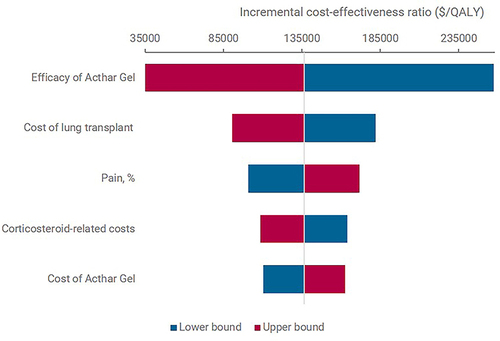
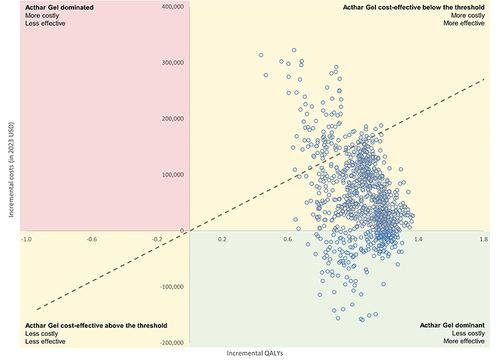
Figure 3 Cost-effectiveness plane comparing Acthar Gel and standard of care.
Note: Base case is presented [Time horizon of 2 years and a payer perspective].
Abbreviations: QALY, quality-adjusted life-year; USD, United States dollars.