130
Views
0
CrossRef citations to date
0
Altmetric
ORIGINAL RESEARCH

Disutility of Cognitive Processing Speed (CPS) Impairment in the Context of Multiple Sclerosis: A Time Trade-Off (TTO) Elicitation Study

, , ORCID Icon, , , , & show all
Pages 55-67 | Received 01 Aug 2023, Accepted 16 Jan 2024, Published online: 08 Feb 2024

Figures & data

Figure 1 Overview flow chart of qualitative and quantitative study activities.

Abbreviations: CPS, cognitive processing speed; HCP, healthcare professional; MS, multiple sclerosis; UK, United Kingdom; US, United States.
Figure 1 Overview flow chart of qualitative and quantitative study activities.

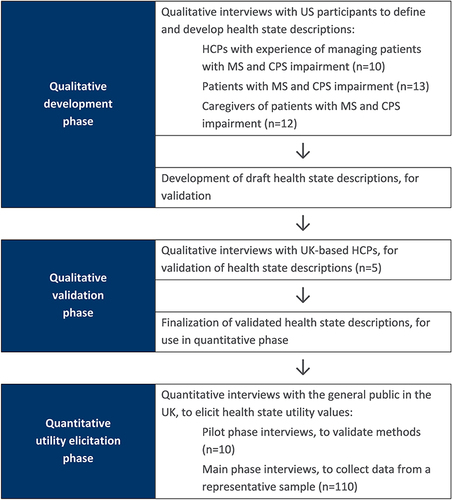
Table 1 Advantages and Disadvantages of Potential Approaches Considered for Generation of Health State Utility Values

Table 2 Health State Definitions (as per Qualitative HCP Insights, Normative SDMT Data, and UK Observational Data in MS)

Table 3 Demographic Characteristics of Participants in TTO Interviews (n=120) and UK Public

Table 4 TTO Utility Value per Health State

Figure 2 TTO utility value per health state (n=120 responses to each). HS1, “mild CPS impairment”: SDMT 43-40 (indicating deficit of ≥22% versus average for a population aged ~55 who are predominantly women; deficit of ≥26% versus average for a population aged ~40); HS2, “moderate CPS impairment”: SDMT 39-32 (indicating deficit of ≥29% versus average for a population aged ~55; who are predominantly women; deficit of ≥33% versus average for a population aged ~40); HS3, “severe CPS impairment”: SDMT ≤31 (indicating deficit of ≥44% versus average for a population aged ~55 who are predominantly women; deficit of ≥47% versus average for a population aged ~40).

Abbreviations: CPS, cognitive processing speed; n, sample size; TTO, time trade-off.
Figure 2 TTO utility value per health state (n=120 responses to each). HS1, “mild CPS impairment”: SDMT 43-40 (indicating deficit of ≥22% versus average for a population aged ~55 who are predominantly women; deficit of ≥26% versus average for a population aged ~40); HS2, “moderate CPS impairment”: SDMT 39-32 (indicating deficit of ≥29% versus average for a population aged ~55; who are predominantly women; deficit of ≥33% versus average for a population aged ~40); HS3, “severe CPS impairment”: SDMT ≤31 (indicating deficit of ≥44% versus average for a population aged ~55 who are predominantly women; deficit of ≥47% versus average for a population aged ~40).

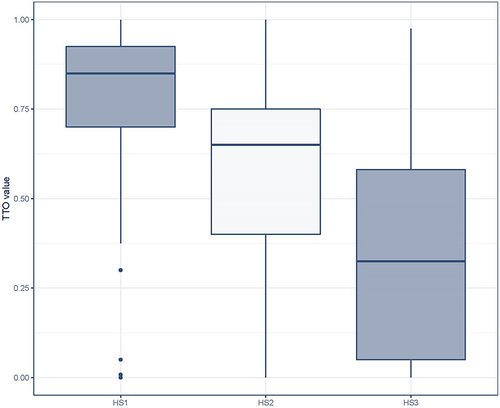
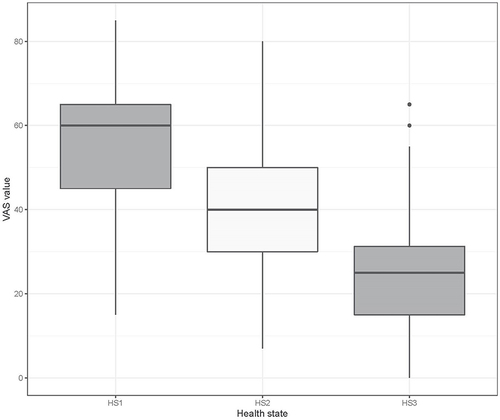
Table 5 VAS Score per Health State

Figure 3 VAS score per health state (n=120 responses to each). HS1, “mild CPS impairment”: SDMT 43-40 (indicating deficit of ≥22% versus average for a population aged ~55 who are predominantly women; deficit of ≥26% versus average for a population aged ~40); HS2, “moderate CPS impairment”: SDMT 39-32 (indicating deficit of ≥29% versus average for a population aged ~55; who are predominantly women; deficit of ≥33% versus average for a population aged ~40); HS3, “severe CPS impairment”: SDMT ≤31 (indicating deficit of ≥44% versus average for a population aged ~55 who are predominantly women; deficit of ≥47% versus average for a population aged ~40).

Abbreviations: CPS, cognitive processing speed; n, sample size; VAS, visual analog scale.
Figure 3 VAS score per health state (n=120 responses to each). HS1, “mild CPS impairment”: SDMT 43-40 (indicating deficit of ≥22% versus average for a population aged ~55 who are predominantly women; deficit of ≥26% versus average for a population aged ~40); HS2, “moderate CPS impairment”: SDMT 39-32 (indicating deficit of ≥29% versus average for a population aged ~55; who are predominantly women; deficit of ≥33% versus average for a population aged ~40); HS3, “severe CPS impairment”: SDMT ≤31 (indicating deficit of ≥44% versus average for a population aged ~55 who are predominantly women; deficit of ≥47% versus average for a population aged ~40).