Figures & data
Figure 1 Model Schematic Depicting Warfarin, NOAC, and LAAC Patient Pathways. Patients enter the model one at a time and are assigned to a treatment pathway with the associated risk of therapy discontinuation or procedural complications. Patients are exposed to the risks of complications for the duration of the model time horizon. *All patients are at risk of death except for patients with transient ischemic attack. However, patients with moderately or severely disabling stroke are at an increased risk of death.
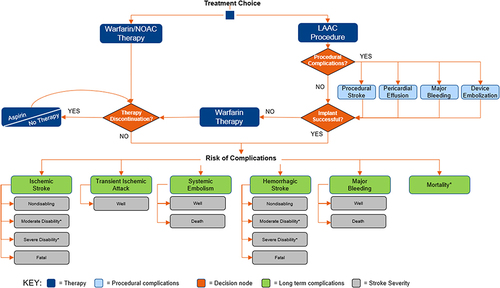
Table 1 Clinical Inputs Derived from Meta-Analyses and Pivotal Trials
Table 2 Stroke Outcomes by Severity
Table 3 Cost Inputs
Figure 2 Cumulative Per-Patient Medicare Costs. Shown are cumulative 10-year per-patient costs to Medicare. Warfarin costs were lower than NOAC costs throughout. LAAC costs were lower than NOAC costs by year 5 and warfarin costs by year 12.
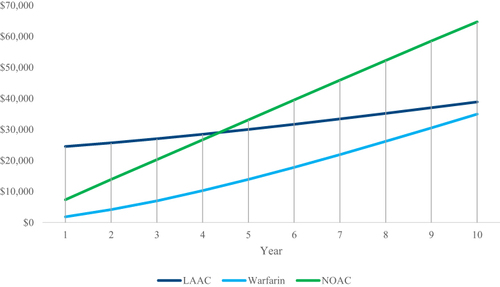
Figure 3 Average Medicare Costs at 10 Years. Shown are Medicare costs per patient at 10 years, sub-divided by therapy and clinical event costs. LAAC and warfarin costs were similar, and both were lower than the cost of NOACs ($25,807 and $29,739 savings, respectively). Clinical event costs comprised 95% of warfarin costs versus 40% for LAAC and 34% for NOACs.
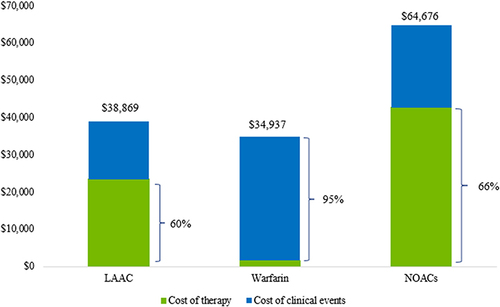
Table 4 Cumulative Total and Sub-Divided Costs at 5 and 10 Years
Figure 4 Cumulative Per-Patient Out-of-Pocket Costs. Shown are cumulative 10-year per-patient costs. At 10 years, cumulative warfarin patient costs were higher than LAAC and NOAC patient costs. LAAC patient costs were lower than those of NOACs by year 3 and warfarin by year 4.
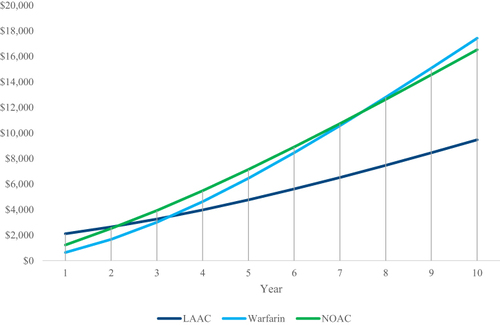
Figure 5 Average Patient Out-of-Pocket Costs at 5 Years. Shown are average patient costs at 5 years, sub-divided by therapy and clinical event costs. LAAC patient costs were 33% lower ($2,382 savings) than those of NOACs and 26% lower ($1,689 savings) than those of warfarin. Clinical event costs comprised 95% of overall warfarin costs versus 64% and 51% of overall LAAC and NOAC costs, respectively.
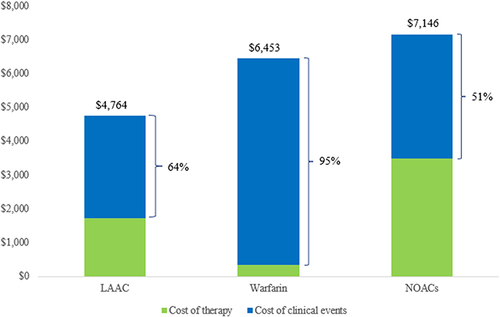
Figure 6 Cumulative Overall (Medicare + Patient) Costs. Shown are the cumulative total (Medicare + patient) per patient costs over 10 years. LAAC becomes less costly than NOACs by year 5 and warfarin by year 9.
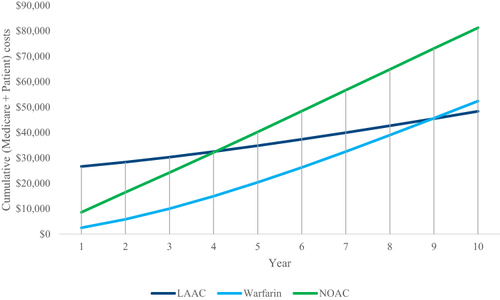
Figure 7 Cumulative Overall (Medicare + Patient) Costs Attributed to Treatment and Event Costs. Shown are overall average costs at 10 years disaggregated by clinical event expenditures and treatment costs. LAAC has the lowest amount of clinical event expenditure, while warfarin has the highest clinical event costs, of which 62% ($30,884) was driven by severely disabling strokes.
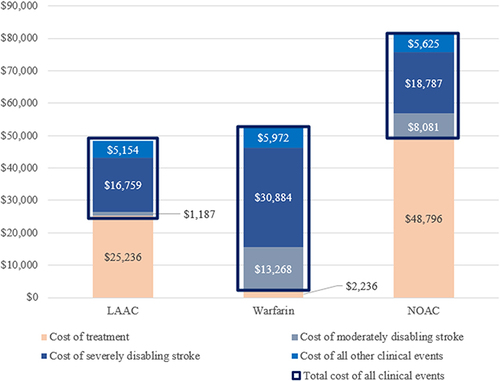
Figure 8 Scenario 1 – Scenario Analysis Exploring Increased Rates of Major Bleeding for Warfarin and NOACs. Shown are warfarin and NOAC Medicare and patient costs at 10 years in the base case compared to the scenario analysis. Warfarin Medicare and patient costs are increased by 2.7% and 1.4%, respectively. NOAC Medicare and patient costs are increased by 0.2% and 0.2%, respectively.
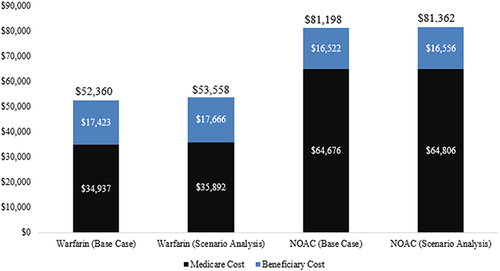
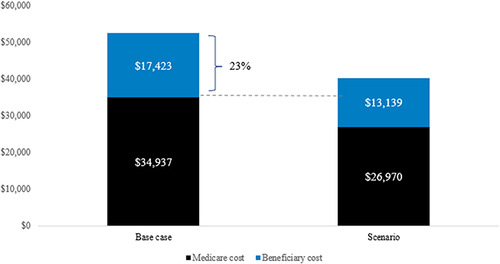
Figure 9 Scenario 2 – Scenario Analysis Exploring a Higher Rate of Non-Disabling Stroke for Warfarin. Shown are warfarin Medicare and patient costs in the base case compared to the scenario analysis. Medicare costs are reduced by 23% and patient costs are reduced by 25% in the scenario analysis.