Figures & data
Table 1 Model Input Parameters
Table 2 Costs Included in the Model
Table 3 Base Case results in 2023 Euros
Figure 1 Base case analysis. (A) Box plot showing total cost savings for MI-TLIF versus O-TLIF based on 1000 PSA iterations. (B) Histogram of the distribution of total cost savings for MI-TLIF versus O-TLIF according to 1000 PSA iterations.
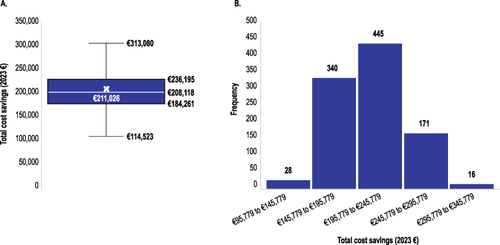
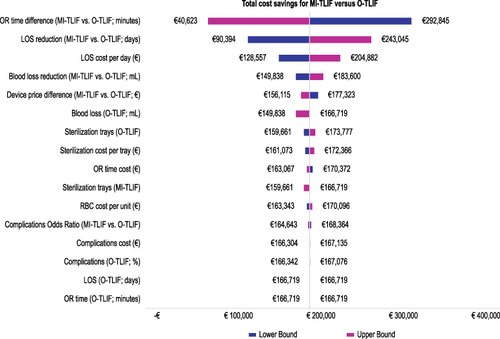
Figure 2 Tornado diagram showing the influence of model parameters in a one-way sensitivity analysis of the base case.
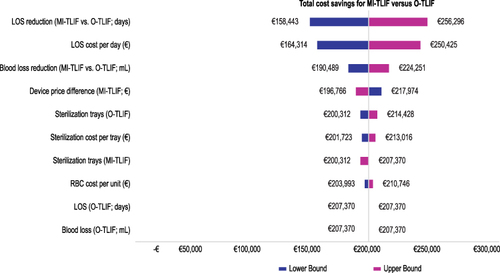
Table 4 Scenario Analysis Results
Figure 3 Scenario analysis. (A) Box plot showing total cost savings for MI-TLIF versus O-TLIF based on 1000 PSA iterations. (B) Histogram of the distribution of total cost savings for MI-TLIF versus O-TLIF according to 1000 PSA iterations.
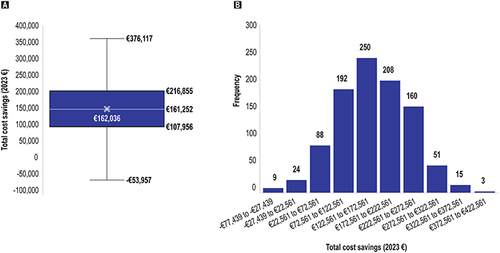
Figure 4 Tornado diagram showing the influence of model parameters in a one-way sensitivity analysis of the scenario analysis.