Figures & data
Table 1 Clinical Characteristics Within 1 Year Prior of Individuals Being Categorized into Either the High-, Moderate-, or Low-Likelihood Groupa
Table 2 Comorbidity Risk Scores Within 1 Year Prior to Individuals Being Categorized into Either the High-, Moderate-, or Low-Likelihood Group
Figure 1 Mean monthly direct medical costs for people in the groups identified as having a high, moderate, or low likelihood of AGHD. Data are presented as the average cost over the analysis period in USD ($) per patient per month for each level of likelihood as follows: (a) Total medical costs, (b) Inpatient and outpatient costs, (c) Medications, and (d) Costs per healthcare element expressed as a percentage of the total direct medical costs (error bars/values in parentheses indicate 95% confidence intervals).
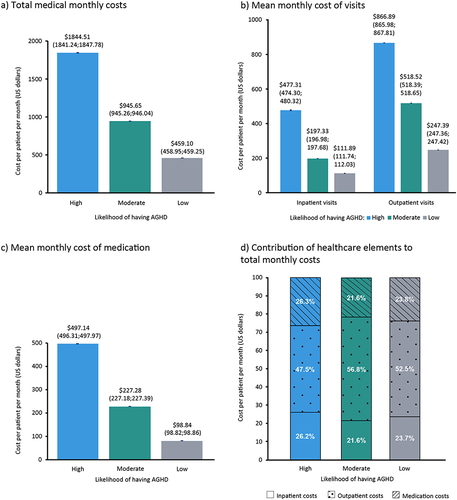
Figure 2 Annual mean cost trajectory for each level of likelihood of AGHD. Data per year are presented for high- and moderate-likelihood groups for the period of 10 years before (−10 years) and after (+10 years) year 0, and for the low-likelihood group over 10 years from the index date for (a) Total direct medical costs in the previous year, (b) Inpatient and outpatient visit costs in the previous year, and (c) Medication-related costs in the previous year.
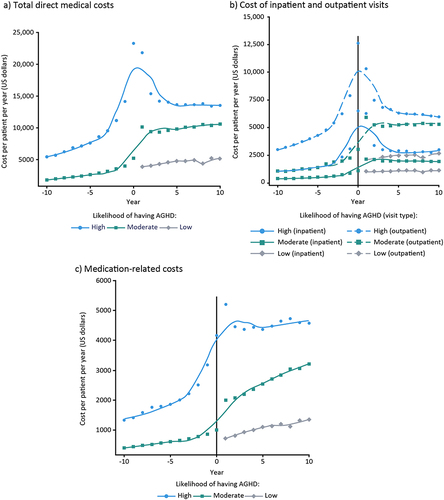
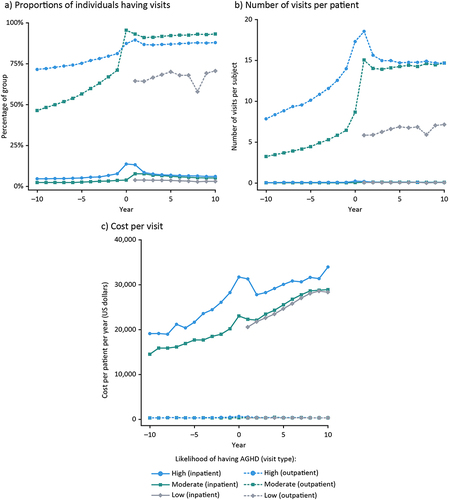
Figure 3 Cost and health visits over time by level of AGHD likelihood. Data per year are presented for high- and moderate-likelihood groups for the period of 10 years before (−10 years) and after (+10 years) year 0, and for the low-likelihood group over 10 years from the index date for (a) The percentage of each likelihood group having a visit at some time in the previous year, (b) The average number of visits per patient in the previous year in each likelihood group and (c) The cost (USD, $) of each visit per patient per year.