
Figures & data
Figure 1 In the decision-tree component of the model, RS result subgroups were defined using cut-offs used in the TAILORx study for N0 (0–10, 11–25, 26–100) and RxPONDER for N1 (0–13, 14–25, 26–100). In the 21-gene assay alternative of the model, chemotherapy assignment was dependent on the subgroup. In the clinical-pathological risk alternative of the model, it differed according to patient age, clinical risk, and menopausal status. Once patients have been assigned their RS result and assigned adjuvant treatment, they proceed to the respective part of the Markov model.
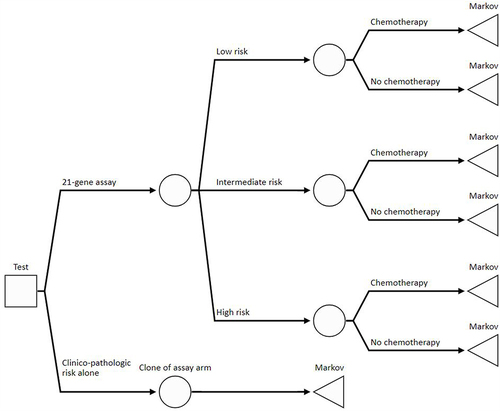
Figure 2 Markov model structure. The model included five health states; the arrows depict patient movement between health states in each model cycle. Patients can move to death from any health state. Patients enter the Markov portion in the “Recurrence-free” health state, and the probability of transition to distant recurrence, AML and CHF is conditional on the assigned adjuvant treatment, clinical risk, and RS category (if known).
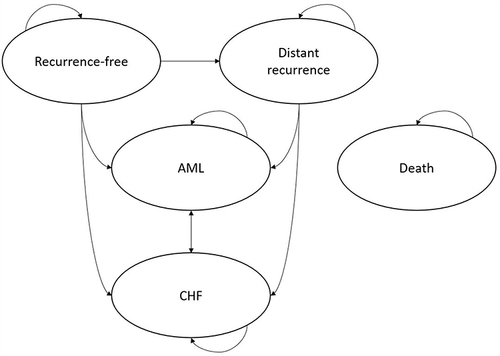
Table 1 Chemotherapy-Related Adverse Events
Table 2 Incremental Cost-Effectiveness of the 21-Gene Assay Compared to Clinical-Pathological Risk Alone N0 Population
Table 3 Incremental Cost-Effectiveness of the 21-Gene Assay Compared to Clinical-Pathological Risk Alone Combined N1 Population
Table 4 Breakdown of Cost for the 21-Gene Assay Compared to Clinical-Pathological Risk Alone N0 Population
Table 5 Breakdown of Cost for the 21-Gene Assay Compared to Clinical-Pathological Risk Alone Combined N1 Population
Figure 3 Tornado diagram reporting the results of one-way sensitivity analyses for the combined N0 population. The endpoint of interest for the one-way sensitivity analyses was net monetary benefit (NMB), which is the product of the threshold willingness-to-pay per QALY in the US ($100,000) and incremental QALYs gained, less incremental cost. NMB is a more appropriate endpoint to measure uncertainty in the presence of negative ICERs, which are difficult to interpret as they can represent both a dominant (higher incremental QALYs and lower incremental cost) and dominated (lower incremental QALYs and higher incremental cost) result.
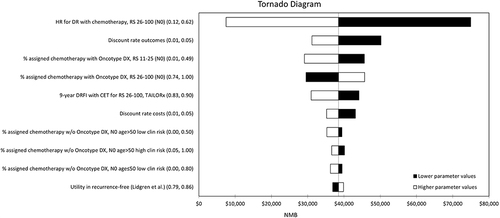
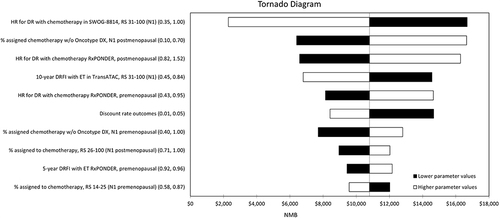
Figure 4 Tornado diagram reporting the results of one-way sensitivity analyses for the combined N1 population.
Data Sharing Statement
Data parameters used in the model are specified in the article and appendices, alongside literature references to allow a reader to re-create the model if needed. For any questions related to the methodology or parameters used in the model, please contact the lead author.