Figures & data
Table 1 Comparison of Eligibility Criteria from Participation in the Pivotal Trials
Table 2 Comparison of the Study Populations of the Respective Trials
Figure 1 Progression-Free Survival (a) and Overall Survival Estimates (b) Used in the CEA Model.
Abbreviations: CEA, Cost-Effectiveness Analysis; A+B, Atezolizumab plus Bevacizumab; SIRT, yttrium-90 (90Y)-loaded Glass microspheres; PFS, Progression-Free Survival; OS, Overall Survival.
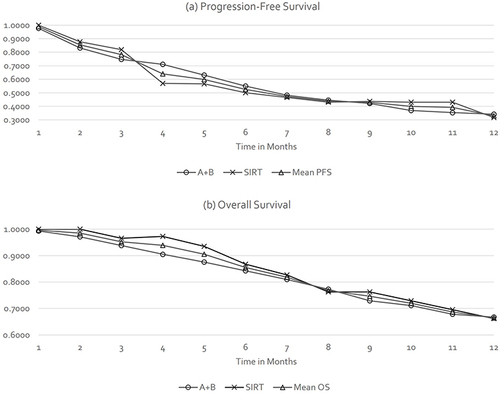
Figure 2 Serious Adverse Events Rates Used in the CEA Model.
Abbreviations: SAE, Serious Adverse Event; A+B, Atezolizumab plus Bevacizumab; SIRT, yttrium-90 (90Y)-loaded Glass microspheres.
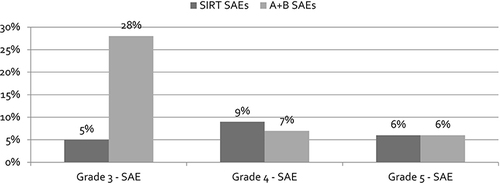
Table 3 Overview of Input Values to the CEA and BIA Models
Table 4 Overview of Deterministic CEA Model Results
Figure 3 Incremental Cost-Effectiveness Planes Comparing A+B vs SIRT from the SHI Perspective.
Abbreviations: SAE, Serious Adverse Event; A+B, Atezolizumab plus Bevacizumab; SIRT, yttrium-90 (90Y)-loaded Glass microspheres; SHI, Statutory Health Insurance; QALY, Quality-Adjusted Life Year.
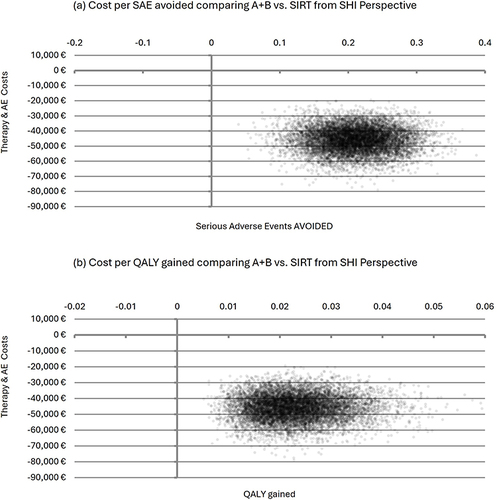
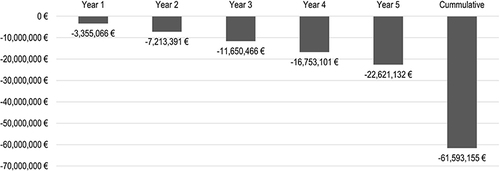
Figure 4 BIA Analysis Results – Total Cost Savings per Year from the SHI Perspective.
Abbreviations: SAE, Serious Adverse Event; SHI, Statutory Health Insurance; QALY, Quality-Adjusted Life Year.