
Figures & data
Table 1 Number of Packs Used for Each SCIT Regime
Figure 1 Summary of cost contributions for SCIT and SLIT regimes across both cohorts.
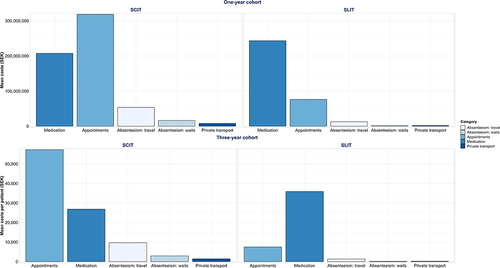
Figure 2 Mean total annual appointment costs (A) with payer breakdowns (B).
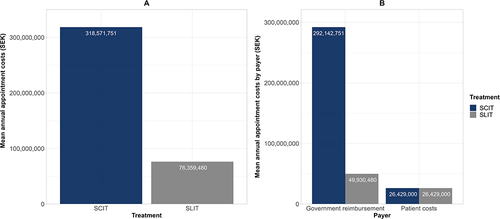
Figure 3 Mean total annual medication costs (A) with payer breakdowns (B).
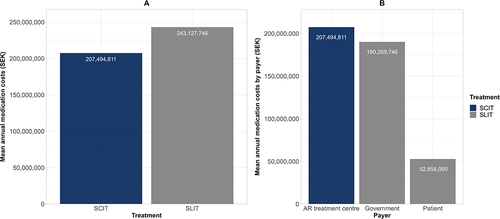
Figure 4 Mean total annual private transport costs (A) with transport mode breakdowns (B).
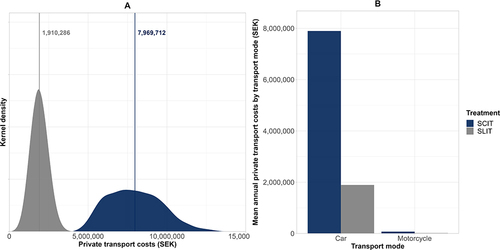
Figure 5 Mean total annual travel absenteeism costs (A) with transport mode breakdowns (B).
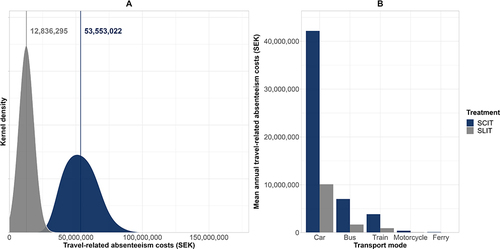
Figure 6 Mean total annual waiting time-related absenteeism.
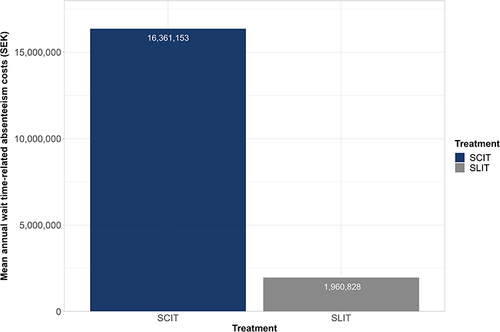
Table 2 Summary of Mean Costs per Category for One-Year and Three-Year Cohorts
Table 3 Results Comparison: Base Case and Sensitivity Analyses
Data Sharing Statement
The raw data supporting the conclusions of this article will be made available by the authors, without undue reservation.