Figures & data
Figure 1 Model schematic for health states of an antiretroviral therapy-naïve HIV-1-infected adult US population.
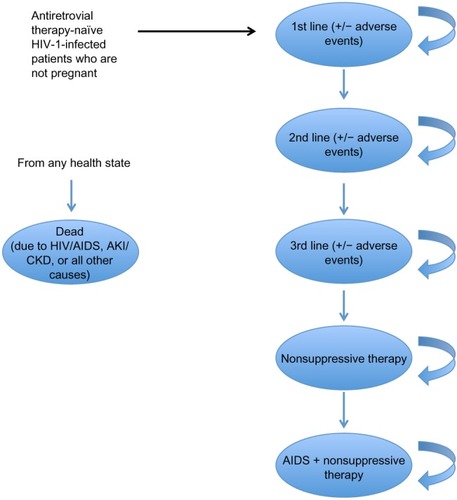
Figure 2 Model schematic for adverse eventsb in an antiretroviral therapy-naïve HIV-1-infected adult US population.
Abbreviations: AKI, acute kidney injury; CKD, chronic kidney disease; HIV, human immunodeficiency virus.
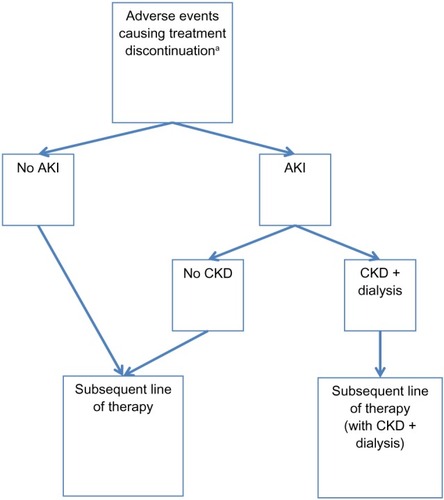
Table 1 Model baseline population of antiretroviral therapy-naïve HIV-1-infected adult patients
Table 2 Model clinical efficacy estimates
Table 3 Model adverse eventTable Footnotea,Table Footnoteb rates by treatment
Table 4 Model costs by treatment, patient monitoring characteristic, and adverse event
Table 5 Model utility estimates by CD4 count and adverse event
Table 6 Summary results for Atripla versus StribildTable Footnotea
Figure 3 One-way sensitivity analyses.a,b
Abbreviations: AE, adverse event; AIDS, acquired immune deficiency syndrome; AKI, acute kidney injury; CKD, chronic kidney disease; LY, life year; QALY, quality-adjusted life year.
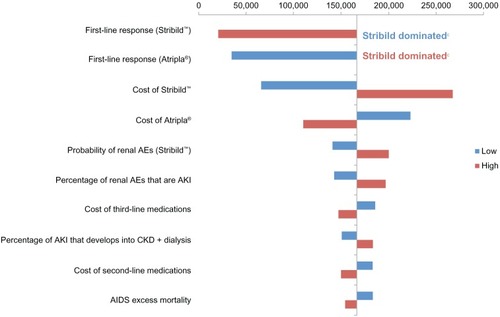
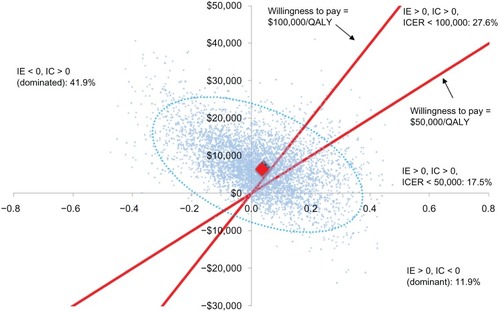
Figure 4 Probabilistic sensitivity analyses.a
Abbreviations: IC, incremental cost; ICER, incremental cost-effectiveness ratio; IE, incremental effectiveness; QALY, quality-adjusted life year.