
Figures & data
Figure 1 Model diagram of the 1-year decision tree.
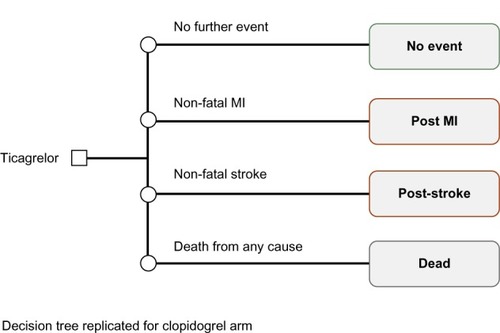
Table 1 One-year decision tree event probabilities
Figure 2 Diagram of the Markov model for post-1-year.
Abbreviations: MI, myocardial infarction; ACS, acute coronary syndrome.
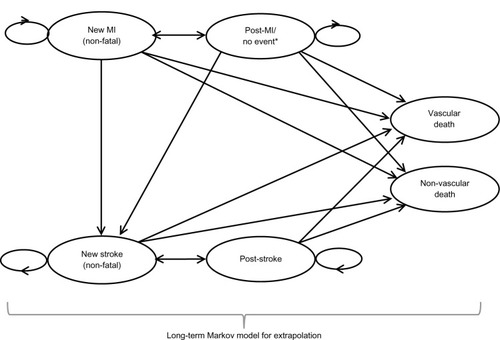
Table 2 Health-related utility values used in the model
Table 3 Resource costs used in the 1-year decision tree and post-1-year Markov model
Table 4 Summary of discounted cost-effectiveness results for different time horizons
Figure 3 Cost-effectiveness acceptability curve for ticagrelor versus generic clopidogrel.
Abbreviations: CEAC, cost-effectiveness acceptability curve; QALY, quality-adjusted life year.
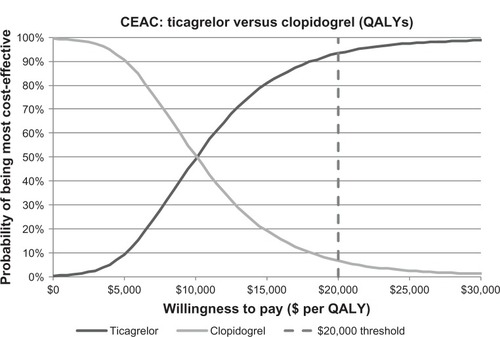
Figure 4 Scatterplot of incremental costs and QALYs for ticagrelor compared to clopidogrel.
Abbreviations: QALY, quality-adjusted life year.
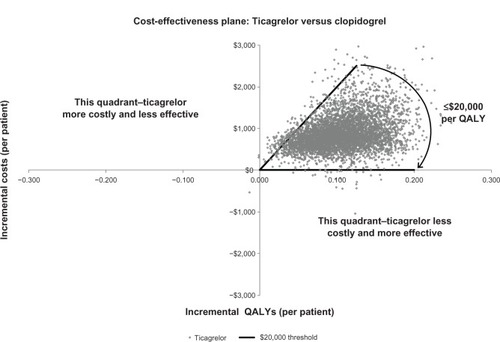
Figure 5 Tornado diagram of one-way sensitivity analyses for ticagrelor versus generic clopidogrel. The light shading represents the higher value for the input and dark shading represents the lower value for the input.
Abbreviations: MI, myocardial infarction; QALY, quality-adjusted life year; vs, versus.
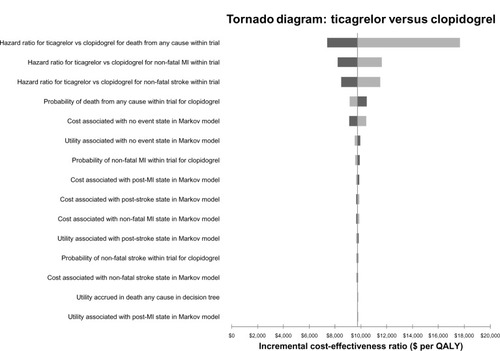
Table 5 Probabilistic base case results (40 years) – cost per QALY and LY (5,000 simulations)
Table S1 Health state costs used in the first year of the model (2011 costs)
Table S2 Unit costs (2011 Canadian$)
Table S3 Values used in one-way sensitivity analysis
Table S4 Summary of probabilistic sensitivity analysis inputs and distributions
Table S5 Output of one-way sensitivity analyses: incremental cost per QALY for ticagrelor versus clopidogrel
Table S6 Summary of subgroup analysis (40-year time horizon)