
Figures & data
Figure 1 Target study population.
Abbreviation: BTcP, breakthrough cancer pain.
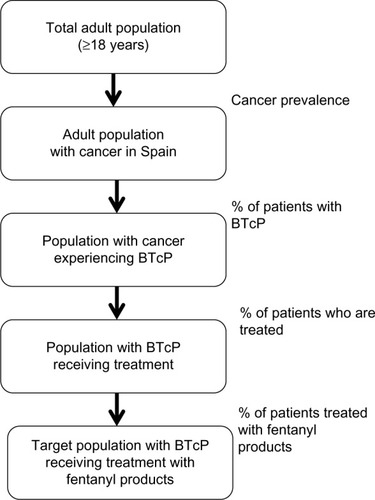
Table 1 Opioids, presentations, costs per dose, and allocation percentages
Table 2 Average number of drug doses and costs in EUR on a day with BTcP episodes
Table 3 Drug costs, medical resource utilization, unit costs, and annual mean cost per patient
Table 4 Distribution of treatments (%): base case analysis and alternative scenario
Table 5 Target population for BTcP treatment
Table 6 Results of the base case budget impact analysis in EUR
Table 7 One-way sensitivity analysis for the most influential variables in the budget impact model