Figures & data
Table 1 Efficacy and cost data for decision-tree model of CAP in Spain (base-case scenario)
Table 2 Initial efficacy, overall susceptibility, and expected effectiveness for ertapenem, ceftriaxone, and imipenem (base-case scenario)
Figure 1 Decision-tree model for treatment of community acquired pneumonia (CAP).
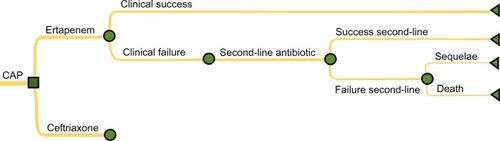
Table 3 Probability estimates, ranges, and distribution parameters used in the model (base-case scenario)
Figure 2 Drug and resource costs per patient for ertapenem- and ceftriaxone-arm (base-case scenario).
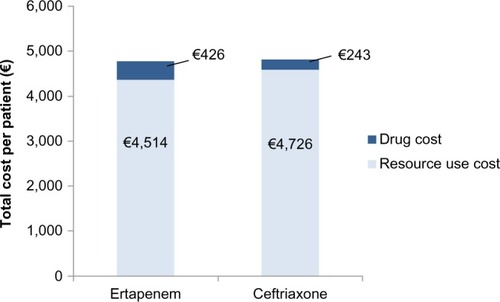
Table 4 Clinical and economic results of the model for the base-case scenario
Table 5 Clinical and economic results of the model for the alternative scenario
Figure 3 One-way sensitivity analysis for length of stay.
Abbreviation: LOS, length of hospital stay.
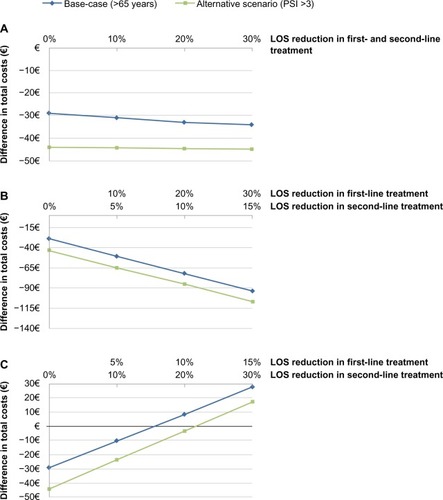
Figure 4 Tornado diagram for the base-case.
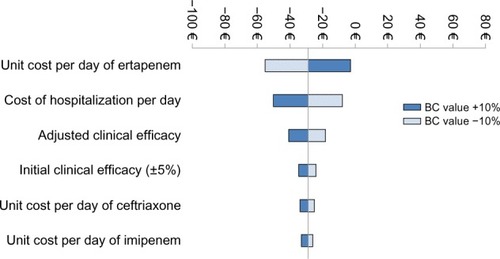
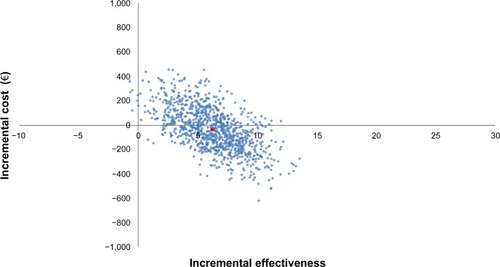
Figure 5 Cost-effectiveness plot for the base-case scenario (>65 years) comparing ertapenem versus ceftriaxone.