
Figures & data
Figure 1 Patient attrition flow chart.
Abbreviations: IV, intravenous; THA, total hip arthroplasty; TKA, total knee arthroplasty; PCA, patient-controlled analgesia.
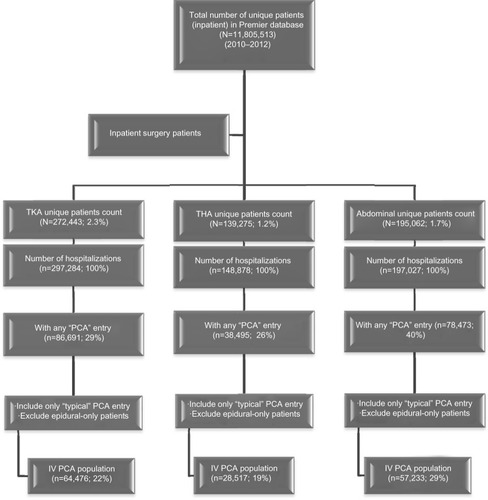
Table 1 Cost per syringe of intravenous PCA opioid drugs (day 0 to 2 from surgery)
Table 2 Per patient total cost of equipment and opioid drugs (day 0 to 2 from surgery)
Figure 2 Average hospital cost component of IV PCA.
Abbreviations: IV, intravenous; THA, total hip arthroplasty; TKA, total knee arthroplasty; PCA, patient-controlled analgesia.
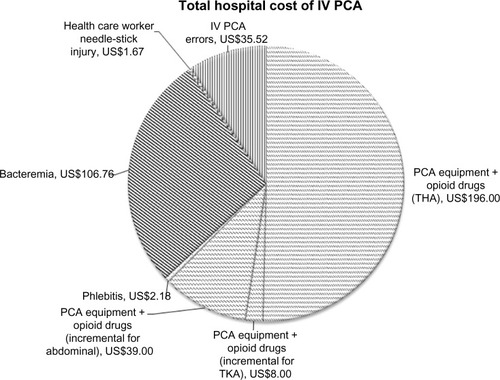
Table 3 Total average per patient cost of postoperative pain management via intravenous PCA