96
Views
8
CrossRef citations to date
0
Altmetric
Original Research

Estimating the real world daily usage and cost for exenatide twice daily and liraglutide in Germany, the Netherlands, and the UK based on volumes dispensed by pharmacies

, , , , , , , , & show all
Pages 95-103 | Published online: 30 Jan 2015

Figures & data

Figure 1 Dosing titration of exenatide twice daily (A) according to the Summary of Product Characteristics. The dosage for exenatide twice daily can be doubled after 4 weeks if better GC is needed.Citation7 The starting dose for liraglutide (B) is 0.6 mg and can be increased after 1 week to 1.2 mg; if better GC is needed, it can be increased to reach 1.8 mg.Citation8

Abbreviation: GC, glycemic control.
Figure 1 Dosing titration of exenatide twice daily (A) according to the Summary of Product Characteristics. The dosage for exenatide twice daily can be doubled after 4 weeks if better GC is needed.Citation7 The starting dose for liraglutide (B) is 0.6 mg and can be increased after 1 week to 1.2 mg; if better GC is needed, it can be increased to reach 1.8 mg.Citation8

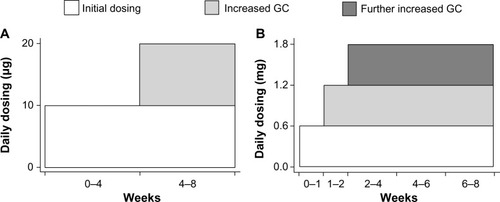
Table 1 Patients meeting inclusion criteria for study

Table 2 Public reimbursed prices of exenatide BID and liraglutide in Germany, the Netherlands, and the UK

Figure 2 Box plot for the daily usage of exenatide twice daily (A) and liraglutide (B) in Germany and the Netherlands (excluding 1% outliers). Median (trimmed dataset) values are represented by horizontal lines within each box. The upper and lower boundaries of each box represent the upper and lower quartiles, respectively. The upper and lower whiskers represent 1.5× the interquartile range. The circles represent data points outside of the whiskers and are defined as outliers. The data label values at both extremes represent the minimum and maximum values.

Figure 2 Box plot for the daily usage of exenatide twice daily (A) and liraglutide (B) in Germany and the Netherlands (excluding 1% outliers). Median (trimmed dataset) values are represented by horizontal lines within each box. The upper and lower boundaries of each box represent the upper and lower quartiles, respectively. The upper and lower whiskers represent 1.5× the interquartile range. The circles represent data points outside of the whiskers and are defined as outliers. The data label values at both extremes represent the minimum and maximum values.

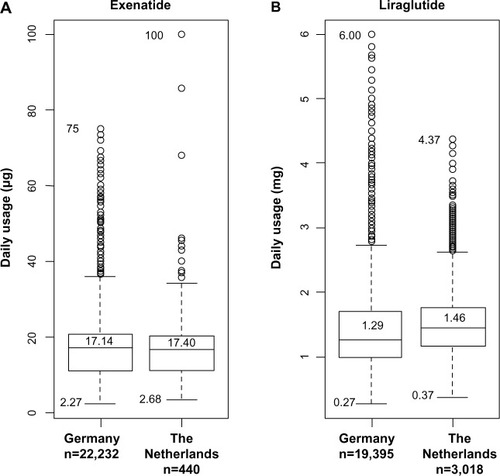
Table 3 Estimated average daily usage and cost of exenatide BID and liraglutide in Germany, the Netherlands, and the UK for total sample and excluding 1% of outliers