
Figures & data
Figure 1 Top ten causes of death in the world in 2012.
Abbreviations: HIV, human immunodeficiency virus; AIDS, acquired immune deficiency syndrome; COPD chronic obstructive pulmonary disease; LRTI, lower respiratory tract infection.
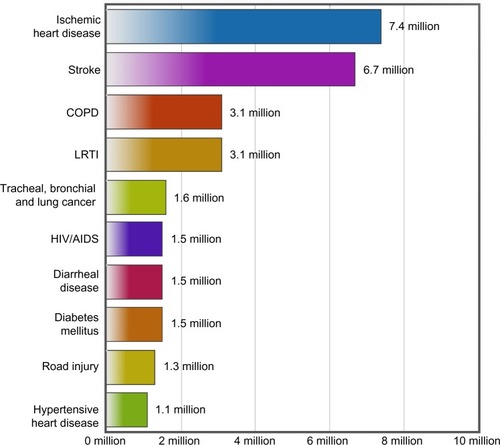
Figure 2 Ten leading causes of death in high income countries in 2012.
Abbreviations: COPD chronic obstructive pulmonary disease; LRTI, lower respiratory tract infection.
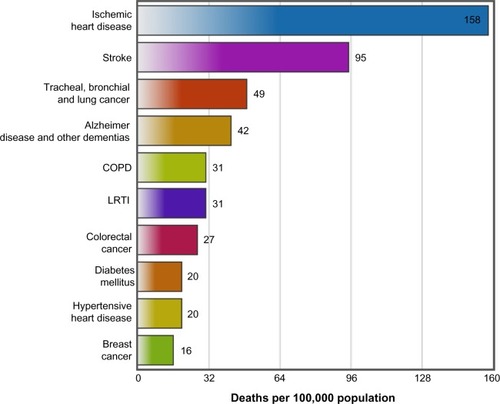
Figure 3 Death rate by 100,000 population for the most common diseases leading to death in Qatar in 2010.Citation10
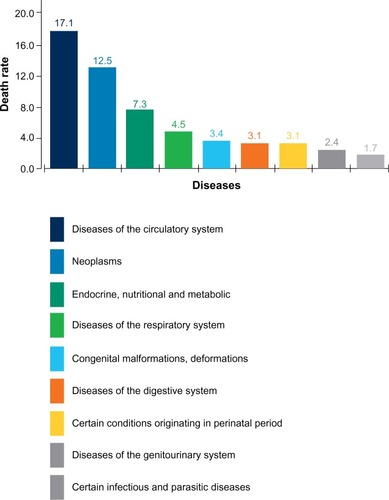
Figure 4 Direct and indirect costs of the five most prevalent noncommunicable diseases (in 2013 $US billion).
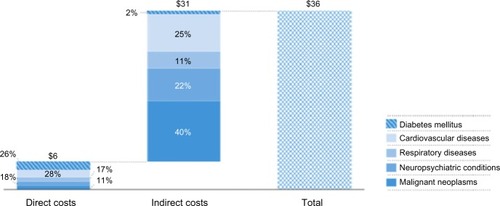
Figure 5 Visits and admissions for noncommunicable diseases in 2013–2022.
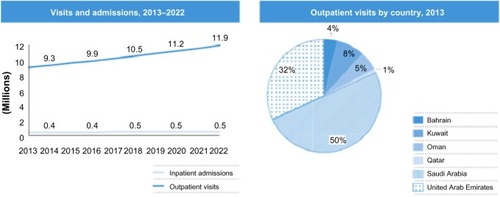
Table 1 Three separate methods were employed to calculate the burden of direct and indirect
Table 3 Noncommunicable disease mortality and DALY criteria
Table 4 Regional ranking of noncommunicable diseases according to economic burden criteria
Figure 6 Top drivers of lost output. Breakdown of costs of noncommunicable diseases by disease type based on the EPIC model.
Abbreviation: EPIC, European Prospective Investigation into Cancer and Nutrition.
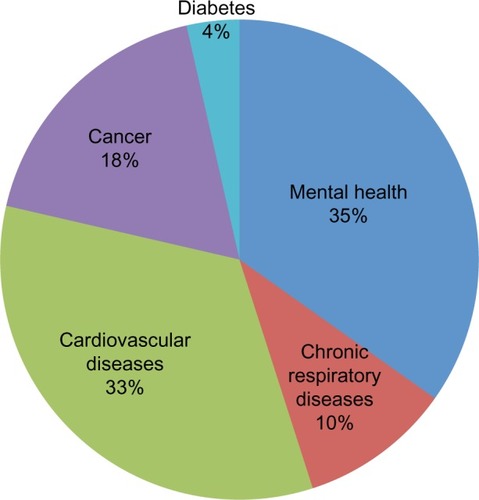
Table 2 Economic burden of noncommunicable diseases for 2011–2013 (trillions of US$), based on the EPICTable Footnote# model
Table 5 Summary of high-impact disease in the Gulf region