
Figures & data
Figure 1 Time to successful management of cow’s milk allergy.
Abbreviations: eHCF, extensively hydrolyzed casein formula; eHCF + LGG, extensively hydrolyzed casein formula plus the probiotic Lactobacillus rhamnosus GG; AAF, amino acid formula.
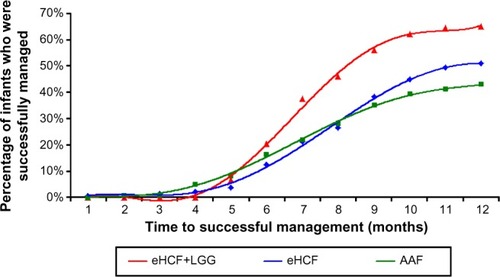
Table 1 Mean cow’s milk allergy-related health care resource use per infant over the study period
Table 2 Cost of infant management (in US $ at 2012 prices)
Figure 2 Distribution of insurers’ costs and time to being successfully managed, generated by bootstrapping.
Abbreviations: eHCF, extensively hydrolyzed casein formula; eHCF + LGG, extensively hydrolyzed casein formula plus the probiotic Lactobacillus rhamnosus GG; AAF, amino acid formula.
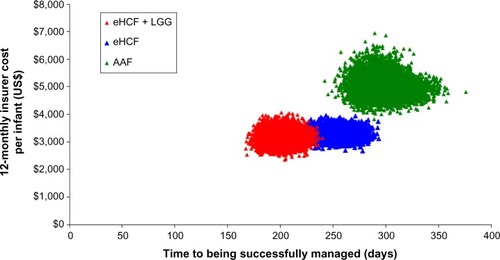
Table 3 Sensitivity analyses