
Figures & data
Table 1 Unit cost per item used in the model
Figure 1 Percent of cases of dose escalation and frequency intensification.
Abbreviation: MTX, methotrexate.
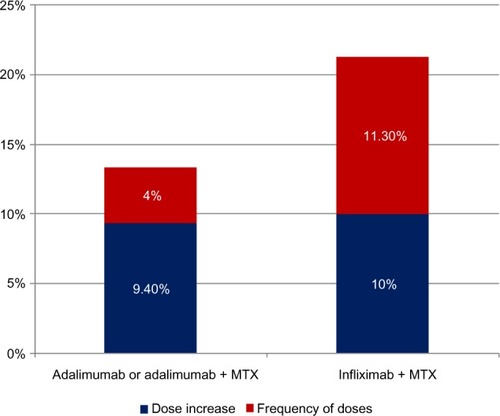
Table 2 The initial dosage scheme of infliximab
Figure 2 Mean total treatment cost per year for new patient.
Note: Results were based on 10,000 Monte Carlo simulations.
Abbreviation: MTX, methotrexate.
Abbreviation: MTX, methotrexate.
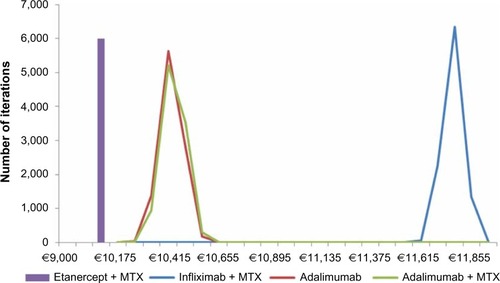
Figure 3 Mean total treatment cost per year for existing patient.
Note: Results were based on 10,000 Monte Carlo simulations.
Abbreviation: MTX, methotrexate.
Abbreviation: MTX, methotrexate.
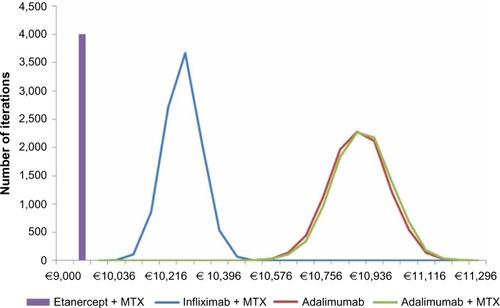
Table 3 Average cost per patient per year for the base case scenario (in €)
Table 4 Average cost per patient per year for two scenario analysis (in €)