
Figures & data
Table 1 Demographic and clinical characteristics of ADPKD and non-ADPKD matched controlTable Footnotea population
Table 2 Demographic and clinical characteristics of ADPKD study population by CKD disease stage
Figure 1 All-cause medical, outpatient pharmacy, and total costs for patients with ADPKD compared with non-ADPKD matched-controla patients during the 6-month observation period (presented by CKD disease stage, in 2010 US dollars). aADPKD patients were grouped by CKD stage and matched by age and sex to a control population without ADPKD. Less than 1.0% of all non-ADPKD matched control patients had a diagnosis for CKD, procedure for dialysis, or an indicator for post-transplant. Plot illustrates the contrast in costs between ADPKD patients and matched controls. Additionally, increasing costs are observed with worsening CKD stage.
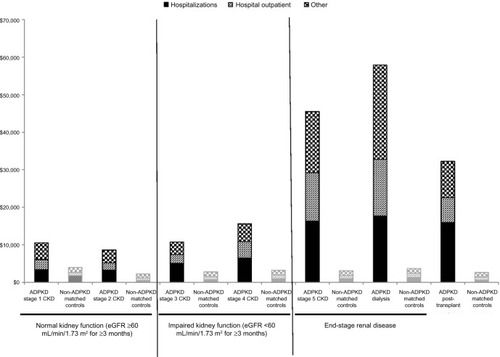
Figure 2 All-cause total costs of patients with ADPKD by disease stage and by subgroup (high risk for early progression, hypertensive, and overall). Plot illustrates the increasing costs observed with worsening CKD stage and impact of subgroup on costs.
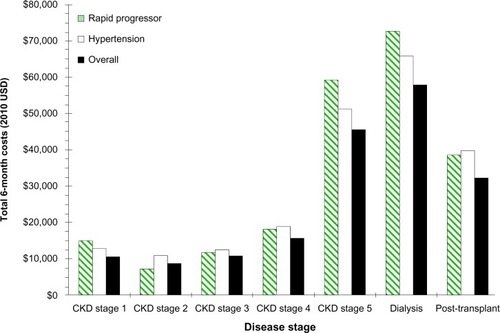
Figure 3 Probability of disease progression by baseline disease stage.
Abbreviation: CKD, chronic kidney disease.
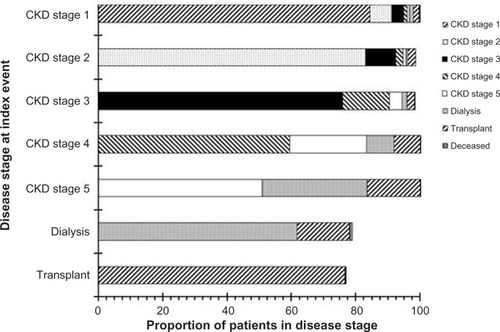
Table 3 Analysis of 6-month MRU and costs between ADPKD and non-ADPKD matched-controlTable Footnotea patients