
Figures & data
Figure 1 Patient flowchart.
Note: *Outliers included length of stay >400 days and hospitalization costs >¥50,000 or ≤¥300.
Abbreviations: N, total number; n, sample number.
Abbreviations: N, total number; n, sample number.
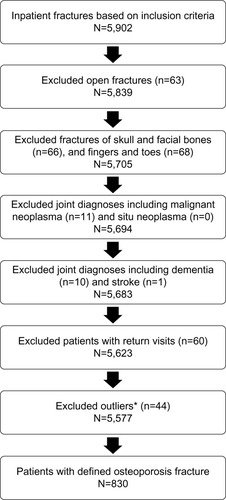
Table 1 Osteoporotic fracture patient demographics
Table 2 Fracture sites per year, 2008–2010
Table 3 Hospital length of stay and hospitalization costs by patient characteristics, insurance type, and fracture type, 2008–2010
Figure 2 Average per-admission hospitalization costs and patient copayment by year.
Abbreviation: RMB, Renminbi.
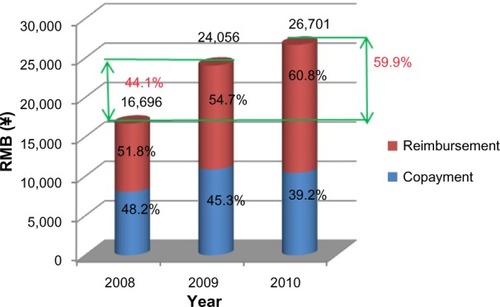
Figure 3 Average per-day hospitalization costs by year.
Abbreviations: RMB, Renminbi.
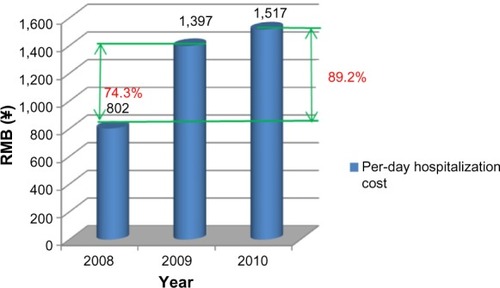
Table 4 Yearly trends in length of stay and costs, 2008–2010
Table 5 Length of stay and hospitalization costs per admission, 2010