Figures & data
Figure 1 Structure of the economic model.
Abbreviation: w/, with.
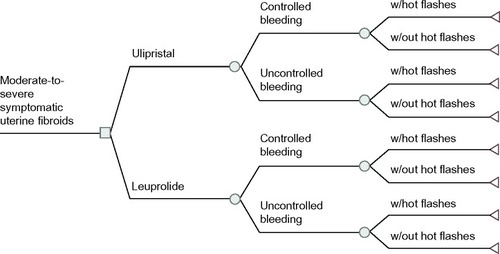
Table 1 Summary of model parameters
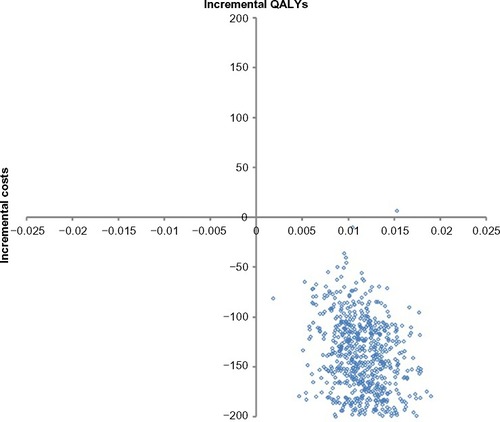
Figure 2 Probabilistic sensitivity analysis base-case (health care payer perspective).
Abbreviation: QALYs, quality-adjusted life years.
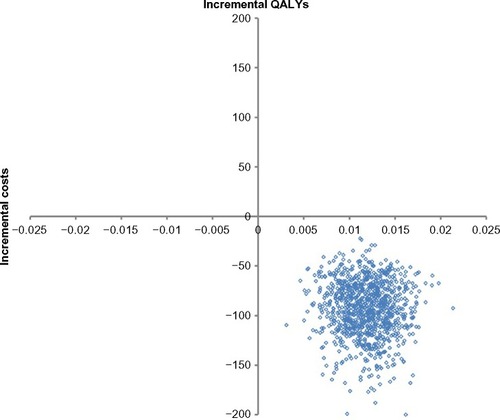
Table 2 Expected results under the base-case scenario
Table 3 Expected cost breakdown under the base-case scenario (deterministic results)
Table 4 Results of one-way univariate sensitivity analysis of the base-case parameters
Figure 3 Cost-effectiveness acceptability curve (CEAC) – when medical assessments are not billed alongside each leuprolide injection.
Abbreviation: ICUR, incremental cost-utility ratio.
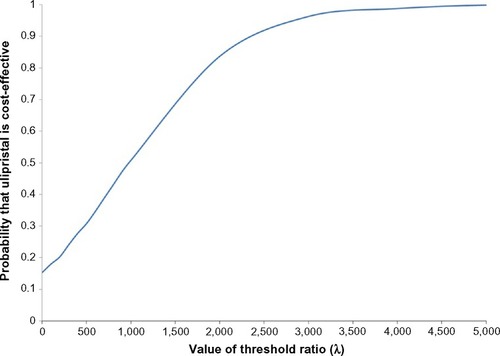
Table 5 Expected results under different methodological assumptions
Figure 4 Probabilistic results when comparator is 11.25 mg, 3-month leuprolide (intramuscular).
Abbreviation: QALYs, quality-adjusted life years.
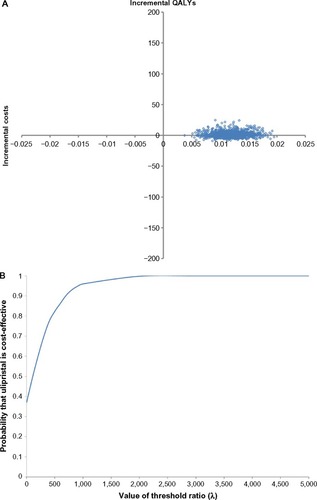
Table 6 Expected results under different scenarios analyses
Figure 5 Probabilistic sensitivity analysis based on 1,000 Monte Carlo simulations – under a societal perspective.