Figures & data
Figure 1 Markov model used to represent the possible health state transitions of Spanish women with postmenopausal osteoporosis.
Notes: The analysis time began from the initiation of fracture prevention treatment until age 100 years or death. This model was developed from Jonssen et alCitation33 with the analyses conducted from the perspective of the Spanish National Health Service. Springer and the original publisher, Osteoporosis International, volume 22, 2010, page 968, Cost-effectiveness of Denosumab for the treatment of postmenopausal osteoporosis, B. Jönsson, O. Ström, J. A. Eisman, A. Papaioannou, E. S. Siris, A. Tosteson, J. A. Kanis, . © International Osteoporosis Foundation and National Osteoporosis Foundation 2010. With kind permission from Springer Science and Business Media.
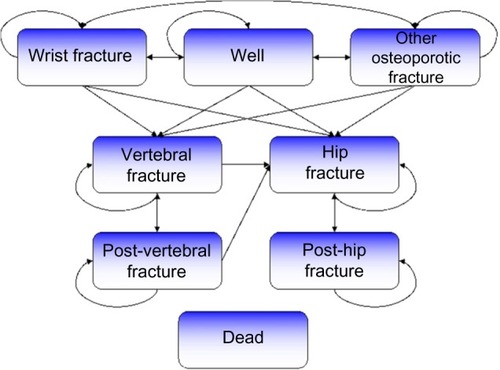
Table 1 Input parameters: efficacy rate (relative risk reduction) relative to placebo
Table 2 Fracture incidence and mortality at selected ages
Table 3 Costs (2013 prices)
Table 4 Utility values and treatment persistence
Table 5 Input distributions for probabilistic sensitivity analysis
Table 6 Results of base case and sensitivity analyses
Table 7 Incremental cost-effectiveness ratios produced in multivariate sensitivity analysis
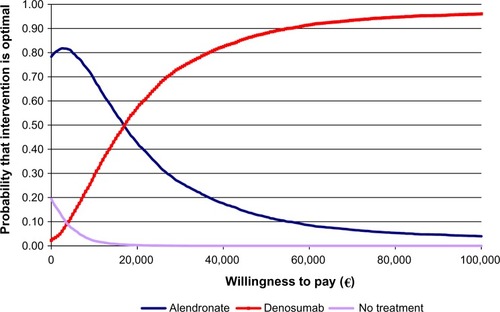
Figure 2 Results of the probabilistic sensitivity analysis showing willingness to pay per quality-adjusted life-year.