
Figures & data
Figure 1 Markov model structure showing health states and possible patient transitions between states.
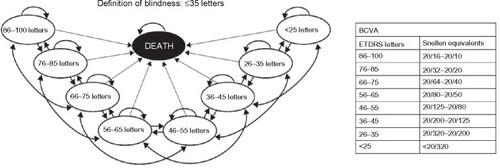
Table 1 Baseline ocular characteristics of patients followed in the model
Table 2 Utilities used by BCVA level and eye status
Table 3 Key model inputs for the base-case scenario
Table 4 Key treatment cost assumptions
Table 5 Base-case cost-effectiveness results per patient
Figure 2 Tornado plots of one-way sensitivity analyses for ranibizumab 0.5 mg PRN compared with aflibercept 2q8.
Assumptions used to determine the input range for the tornado plot: Ranibizumab PRN versus aflibercept OR values are based on the 95% CrI from the published network meta-analysis.Citation24 The range in the number of ranibizumab PRN injections over 3 years was based on the 95% confidence interval from the RESTORE 36-month data.Citation40 The range in the number of PRN injections in the first year was based on the weighted injection average across RESTORECitation16 and RESPOND.Citation41 The lower value for the number of aflibercept injections assumed the same injection frequency as the ranibizumab PRN regimen. Ranibizumab maximal monitoring frequency assumed monthly monitoring (as described in the RESTORE protocol).Citation16
Abbreviations: PRN, pro re nata; 2q8, 2 mg every 8 weeks after five initial monthly doses; NMB, net monetary benefit; CrI, credible interval.
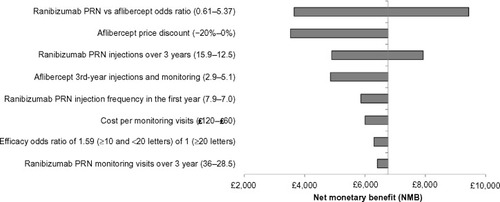
Figure 3 Scatter plots for probabilistic sensitivity analysis showing cost-effectiveness of (A) ranibizumab 0.5 mg PRN and (B) ranibizumab 0.5 mg T&E compared with aflibercept 2q8.
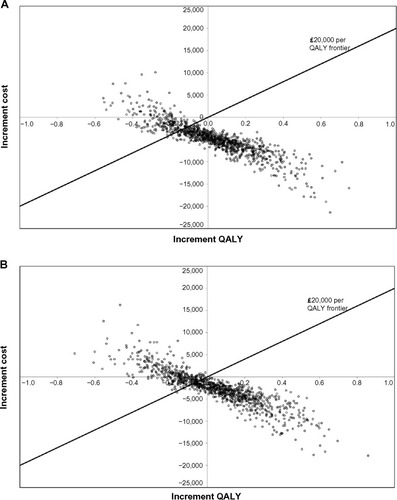
Figure 4 Cost-effectiveness acceptability curves for (A) ranibizumab 0.5 mg PRN and (B) ranibizumab 0.5 mg T&E compared with aflibercept 2q8.
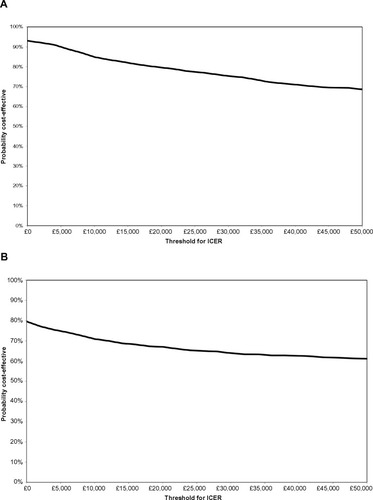
Table S1 Calculation of aflibercept transition probabilities
Table S2 Costs of visual impairment
Table S3 Key variables with varying value in the probability sensitivity analysis