
Figures & data
Figure 1 Illustration of the gamble.
Notes: A and B are the two alternative choices. Choice B results in a lottery with outcome B1 with probability p and outcome B2 with probability 1-p.
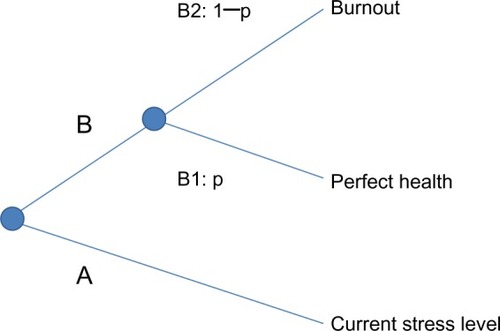
Table 1 Student characteristics and quality of life values
Table 2 Subgroup results for quality of life values
Table 3 Determinants of quality of life