
Figures & data
Table 1 Details of the unit costs and lost labor productivity (2013)
Figure 1 General outline of the study.
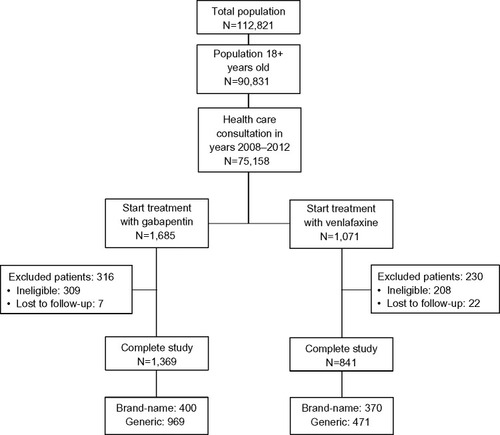
Table 2 Baseline characteristics of study series
Figure 2 Persistence curve for initial treatment (gabapentin, venlafaxine): comparison of the brand medication with the generic.
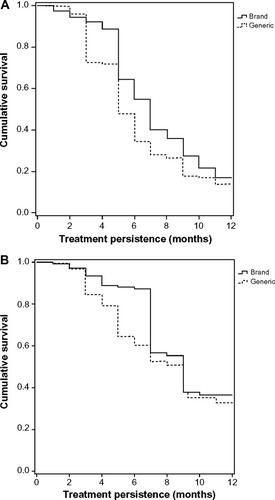
Table 3 Characteristics of medication use: treatment adherence/compliance and persistence
Table 4 Medication prescribed to the patients in pre-treatment (6 previous months) and treatment (12-month follow-up)
Table 5 Use of health care resources and working days lost due to sickness
Table 6 Health care and non-health care costs (lost labor productivity) by study group
Table 7 Variation of pain intensity and anxiety symptoms between baseline and treatment discontinuation by study group