
Figures & data
Table 1 Prevalence of CD
Table 2 Market share and absolute number of patients receiving BoNT-A
Table 3 BoNT-A medication treatment cost and dosage
Table 4 Resource use for BoNT-A and best supportive care (without BoNT-A) arms in the base case
Table 5 BoNT-A medication dosage for “real-world” settings
Table 6 Net 5-year budget impact of increasing abobotulinumtoxinA market share compared to status quo assumptions in the treatment of cervical dystonia in the UK
Figure 1 Cost of BoNT-A and best supportive care per patient per year by cost component.
Abbreviation: BoNT-A, botulinum neurotoxin A.
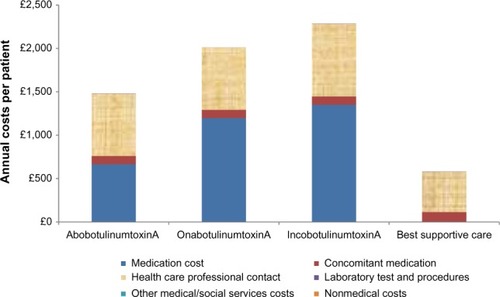
Figure 2 Tornado diagram of one-way sensitivity analysis showing the parameters that are most influential on net budget impact.
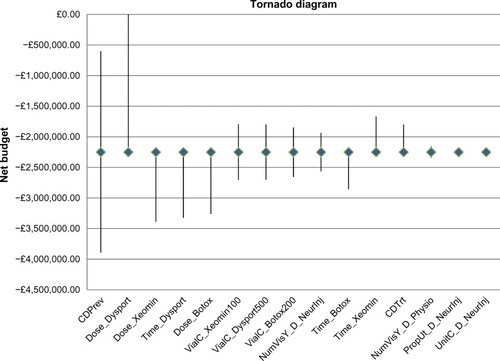
Table 7 Variable description for tornado diagram