
Figures & data
Figure 1 Patient identification flow chart.
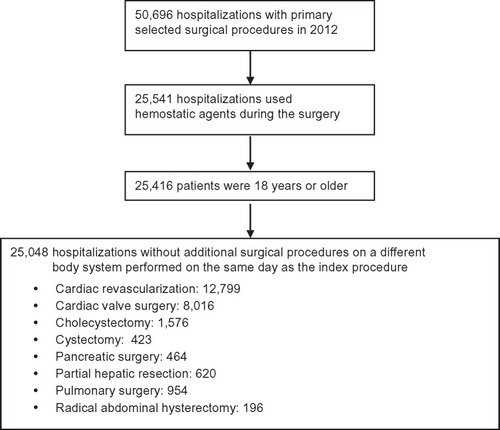
Table 1 Baseline patient demographics and admitting hospital characteristics
Table 2 Hospital characteristics
Figure 2 Percentage of patients with a major bleeding event despite hemostat use, stratified by surgery group.
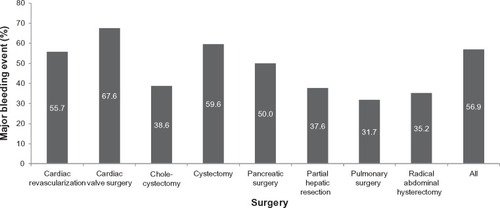
Figure 3 Patient mortality, stratified by surgery type and presence or absence of uncontrolled bleeding despite hemostat use.
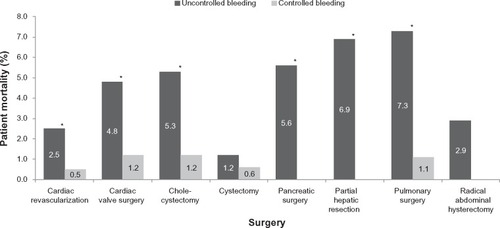
Table 3 Unadjusted mean (SD) costs and resource use, stratified by surgical procedure and presence or absence of uncontrolled bleeding despite hemostat use
Table 4 Mean adjusted all-cause costs (95% CI) and mean adjusted hospital LOS (95% CI) for controlled versus uncontrolled bleeding in patients treated with hemostatic agents, stratified by surgical procedure
Table S1 Selected primary surgical procedures
Table S2 Hemostatic agents
Table S3 Major bleeding events
Table S4 Infections
Table S5 Transfusion coding descriptions