
Figures & data
Figure 1 Summary of methods.
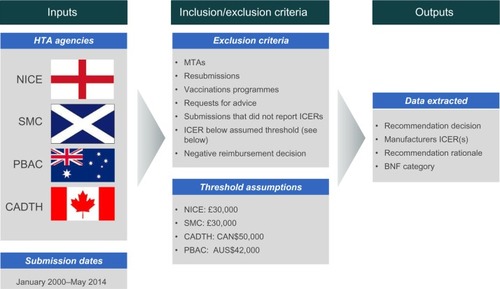
Table 1 Acceptance rates for total submissions and for submissions with ICERs higher than the threshold (N=679)
Figure 2 HTA submission outcomes by disease area, for total submissions (top, darker bars) and submissions with ICERs higher than the threshold (bottom, lower bars).
Abbreviations: ICER, incremental cost-effectiveness ratio; NICE, National Institute for Health and Care Excellence; SMC, Scottish Medicines Consortium; CADTH, Canadian Agency for Drugs and Technologies in Health; PBAC, Pharmaceutical Benefits Advisory Committee.
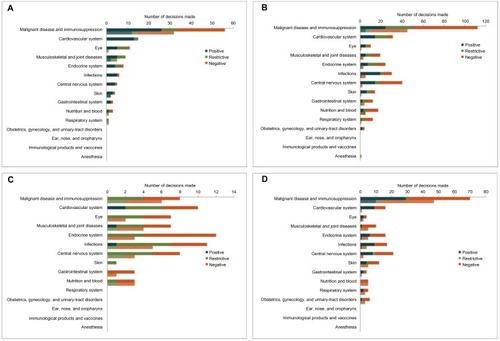
Figure 3 Funnel plot demonstrating difference in acceptance rates for submissions with ICERs higher than the threshold for different disease areas.
Abbreviations: CNS, central nervous system; ICER, incremental cost-effectiveness ratio; O and G and UTDs, obstetrics, gynecology, and urinary tract disorders.
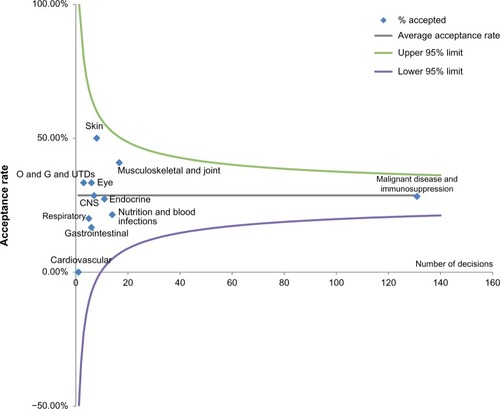
Table S1 List of all submissions that were accepted with ICERs higher than the threshold, by HTA agency
Table S2 Acceptance of submissions with ICERs higher than the threshold by disease area
Table S3 Chi-square test “Is there evidence that acceptance rates above the accepted thresholds are higher for some therapeutic areas than for others?”