
Figures & data
Table 1 Biosimilar drugs marketed in Italy
Table 2 Consumption rates for biosimilar drugs in the Campania region vs Italy, from 2009 to 2013
Table 3 Expenditure in Euro (€) on biosimilar drugs, 2009–2013, in the Campania region vs Italy
Table 4 Pharmaceutical cost containment policies developed in the Campania region to incentivize the use of biosimilars
Figure 1 Consumption of epoetin from 2009 to 2013 in the Campania region (A), and in Italy (B).
Note: Data modified from references.Citation18–Citation21
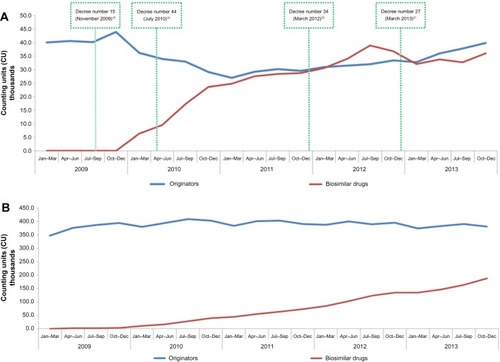
Table S1 Expenditure in Euro (€) on biosimilar drugs and biological drugs, 2009–2013, Italy
Table S2 Expenditure in Euro (€) on biosimilar drugs and biological drugs, 2009–2013, Campania region