
Figures & data
Figure 1 Cohort simulation using a Markov model.
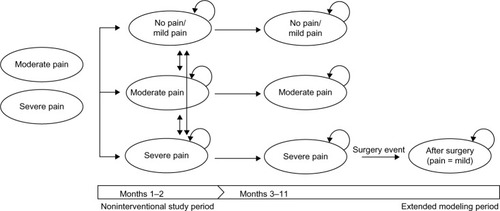
Figure 2 Design of the physician questionnaire for determining resource utilization.
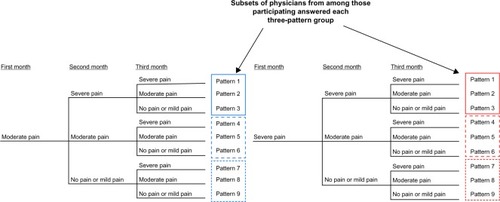
Table 1 Estimated direct costs
Table 2 Costs of outpatient visits, imaging, and drugs
Table 3 Base case analysis
Table 4 Sensitivity analysis on key variables
Figure 3 Tornado diagram of the 20 most sensitive parameters in the one-way sensitivity analysis.
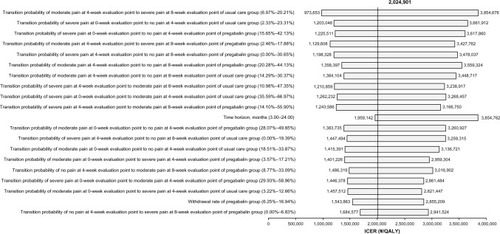
Figure 4 Cost-effectiveness acceptability curve for pregabalin.
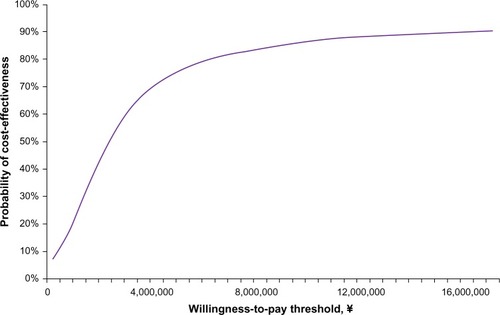
Table S1 Information for determining health care resource utiilization
Table S2 Method of cost calculation
Table S3 Number of outpatient visits per month
Table S4 Proportion of patients having X-ray
Table S5 Number of X-ray tests per month in patients having one or more tests in each month
Table S6 Proportion of patients having an MRI
Table S7 Number of MRI tests per month in patients having one or more tests in each month
Table S8 Proportion of physicians reporting use of acetaminophen (paracetamol)
Table S9 Acetaminophen (paracetamol) use, mg per day
Table S10 Proportion of physicians reporting use of neurotropin
Table S11 Use of neurotropin, units per day
Table S12 Proportion of physicians reporting use of tramadol
Table S13 Tramadol use, mg per day
Table S14 Proportion of physicians reporting use of nonsteroidal anti-inflammatory drugs
Table S15 Use of nonsteroidal anti-inflammatory drugs (loxoprofen), mg per dayTable Footnotea