Figures & data
Table 1 Demographic characteristics, Charlson comorbidity index, and comorbid conditions of the incident cases by year
Table 2 Number of patients being dispensed medication at least onceTable Footnotea by year from 2005 to 2009
Table 3 Number of patients undergoing an imaging procedure one or more times by year from 2005 to 2009Table Footnotea
Figure 1 Person-year incidence rates from 2005 to 2010.
Notes: The person-year incidence rates increased over time. In 2005, the person-year incidence rate was 5.63/1,000 persons (95% CI, 5.32–5.94). By 2010, the person-year incidence rate was 8.18/1,000 persons (95% CI, 7.78–8.57). Incident rates were determined based on a closed cohort of patients who were ≥50 years of age at the beginning of 2005 and were not diagnosed with Alzheimer’s disease prior to 2005. Error bars shown in figure represent 95% CIs.
Abbreviation: CI, confidence interval.
Abbreviation: CI, confidence interval.
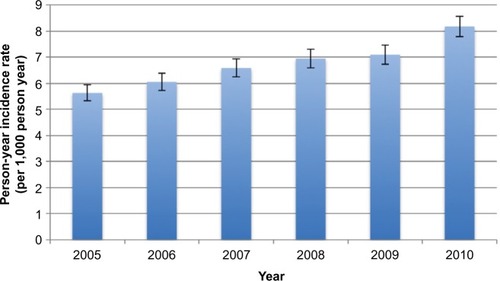
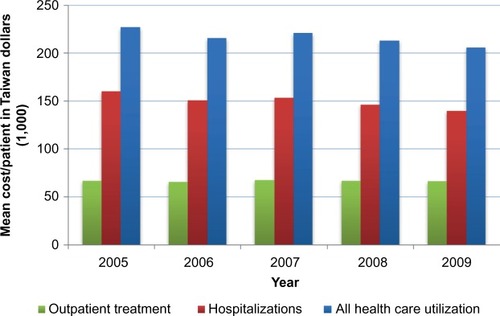
Figure 2 Mean cost of outpatient treatment, hospitalizations, and all health care utilization by year from 2005 to 2010 (inflated to 2009 Taiwan dollars).
Notes: The total mean costs (including outpatient treatment and hospitalizations) per person ranged from NT$205,413 (SD 460,900) in 2009 to NT$217,287 (SD 438,835) in 2005. For each year, mean hospitalization costs per person accounted for the majority of the total costs per person. Costs were based on expenditures in the first year after diagnosis of Alzheimer’s disease and were adjusted for survival.
Abbreviations: NT$, new Taiwan dollars; SD, standard deviation.
Abbreviations: NT$, new Taiwan dollars; SD, standard deviation.